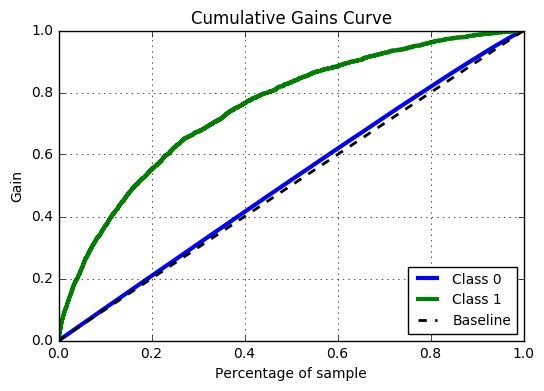
Interpretar la curva de ganancias acumuladas
Has creado un modelo para predecir qué personas donantes tienen más probabilidades de reaccionar ante una campaña y has trazado la curva de ganancias acumuladas que aparece abajo. Supón que tienes presupuesto para enviar una carta a las 30 000 mejores personas donantes de entre 100 000. ¿A cuántos objetivos (donantes que reaccionan) habrás alcanzado si hay 5 000 objetivos entre los 100 000 donantes? Recuerda que la curva de ganancias acumuladas muestra, para cada valor x del eje horizontal, el porcentaje de objetivos alcanzado al usar el modelo.
Este ejercicio forma parte del curso
Introducción al análisis predictivo en Python
ejercicio interactivo práctico
Convierte la teoría en práctica con uno de nuestros ejercicios interactivos
 Empezar ejercicio