Eine Aufzählungsliste erstellen
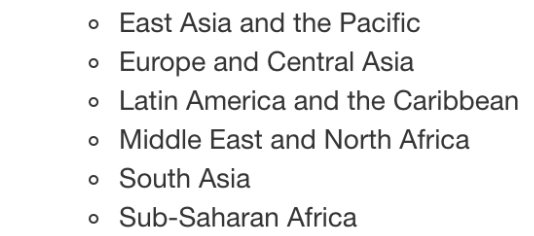
Bisher hast du gelernt, wie du Text zu deiner Markdown-Datei hinzufügst, um zusätzliche Informationen für dein Publikum bereitzustellen. Jetzt erstellst du eine Aufzählungsliste, um anzugeben, welche Regionen in den Daten investment_annual_summary enthalten sind. Schau dir das Bild aus dem Video unten an, um dich an die Regionen zu erinnern, die in deiner Tabelle enthalten sein sollen.
Diese Übung ist Teil des Kurses
<Kurs>Berichten mit R Markdown</Kurs>Übungsanweisungen
- Füge dem Bericht ab Zeile
27eine Aufzählungsliste mit allen in den Daten enthaltenen Regionen hinzu: East Asia and the Pacific, Europe and Central Asia, Latin America and the Caribbean, Middle East and North Africa, South Asia und Sub-Saharan Africa.
Interaktive praktische Übung
Versuche dich an dieser Übung, indem du diesen Beispielcode vervollständigst.
{"investment_report.Rmd":"---\ntitle: \"Investment Report\"\ndate: \"`r format(Sys.time(), '%d %B %Y')`\"\noutput: html_document\n---\n\n```{r setup, include = FALSE}\nknitr::opts_chunk$set(fig.align = 'center', echo = TRUE)\n```\n\n```{r data, include = FALSE}\nlibrary(readr)\nlibrary(dplyr)\nlibrary(ggplot2)\n\ninvestment_annual_summary <- read_csv(\"https://assets.datacamp.com/production/repositories/5756/datasets/d0251f26117bbcf0ea96ac276555b9003f4f7372/investment_annual_summary.csv\")\ninvestment_region_summary <- read_csv(\"https://assets.datacamp.com/production/repositories/5756/datasets/52f5414f6504e0503e86eb1043afa9b3d157fab2/investment_region_summary.csv\")\ninvestment_services_projects <- read_csv(\"https://assets.datacamp.com/production/repositories/5756/datasets/bcb2e39ecbe521f4b414a21e35f7b8b5c50aec64/investment_services_projects.csv\")\n```\n\n\n## Datasets \n### Investment Annual Summary\nThe `investment_annual_summary` dataset provides a summary of the dollars in millions provided to each of the following regions for each fiscal year, from 2012 to 2018:\n\n\n\n\n\n\n\n\n```{r investment-annual-summary, out.width = '85%', fig.cap = 'Figure 1.1 The Investment Annual Summary for each region for 2012 to 2018.'}\nggplot(investment_annual_summary, aes(x = fiscal_year, y = dollars_in_millions, color = region)) +\n geom_line() +\n labs(\n title = \"Investment Annual Summary\",\n x = \"Fiscal Year\",\n y = \"Dollars in Millions\"\n )\n```\n\n### Investment Projects in Brazil\nThe `investment_services_projects` dataset provides information about each investment project from 2012 to 2018. Information listed includes the project name, company name, sector, project status, and investment amounts.\n\n```{r brazil-investment-projects, out.width = '95%', fig.cap = 'Figure 1.2 The Investment Services Projects in Brazil from 2012 to 2018.'}\nbrazil_investment_projects <- investment_services_projects %>%\n filter(country == \"Brazil\") \n\nggplot(brazil_investment_projects, aes(x = date_disclosed, y = total_investment, color = status)) +\n geom_point() +\n labs(\n title = \"Investment Services Projects in Brazil\",\n x = \"Date Disclosed\",\n y = \"Total IFC Investment in Dollars in Millions\"\n )\n```\n\n### Investment Projects in Brazil in 2018\nThe `investment_services_projects` dataset was filtered below to focus on information about each investment project from the 2018 fiscal year, and is referred to as `brazil_investment_projects_2018`. \n\n```{r brazil-investment-projects-2018, out.width = '95%', fig.cap = 'Figure 1.3 The Investment Services Projects in Brazil in 2018.'}\nbrazil_investment_projects_2018 <- investment_services_projects %>%\n filter(country == \"Brazil\",\n date_disclosed >= \"2017-07-01\",\n date_disclosed <= \"2018-06-30\") \n\nggplot(brazil_investment_projects_2018, aes(x = date_disclosed, y = total_investment, color = status)) +\n geom_point() +\n labs(\n title = \"Investment Services Projects in Brazil in 2018\",\n x = \"Date Disclosed\",\n y = \"Total IFC Investment in Dollars in Millions\"\n ) \n```\n\n\n"}