Relational Neighbor Classifier
In dieser Übung wendest du einen einfachen, netzwerkbasierten Klassifikator an: den relational neighbor classifier.
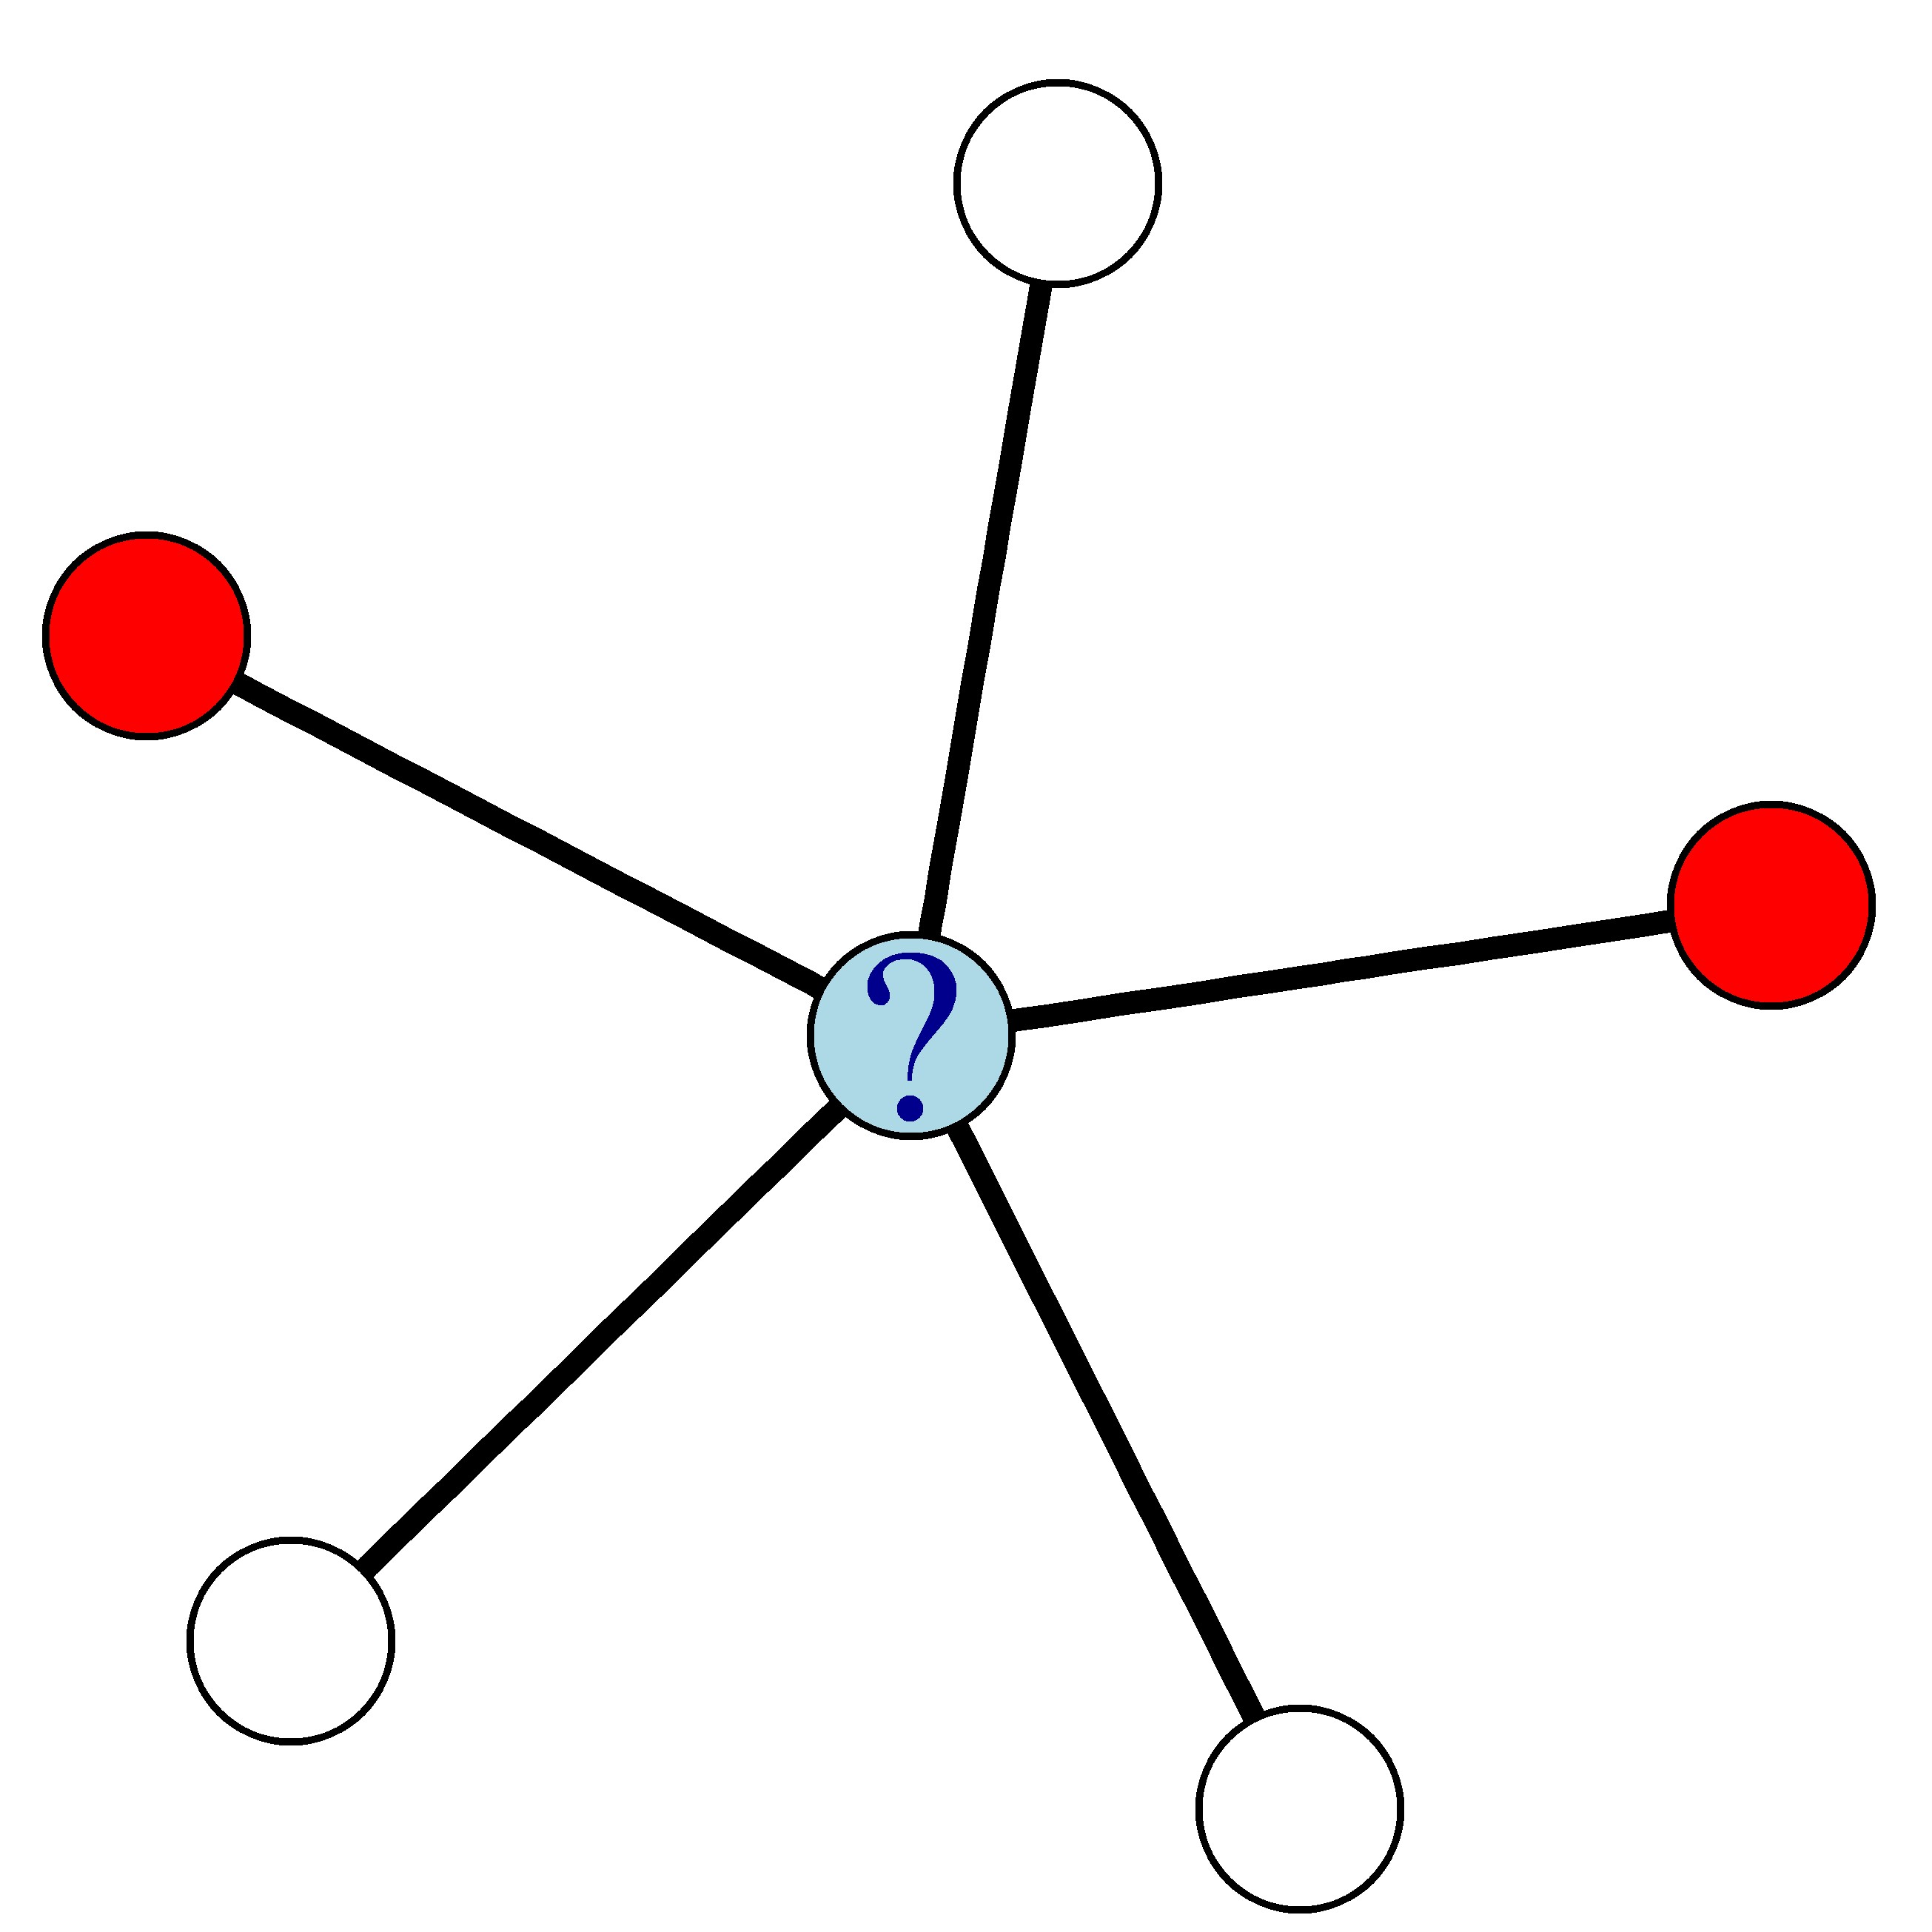
Er nutzt die Klassenlabels der Nachbarknoten, um für jeden Knoten im Netzwerk eine Churn-Wahrscheinlichkeit zu berechnen.
Im untenstehenden Netzwerk, in dem rote Knoten Kündiger und weiße Knoten Nicht-Kündiger darstellen, beträgt die Churn-Wahrscheinlichkeit des blauen Knotens 0,4.
Du bekommst zwei Vektoren: ChurnNeighbors und NonChurnNeighbors, die für jeden Kunden die Anzahl der Nachbarn enthalten, die gekündigt bzw. nicht gekündigt haben.
Diese Übung ist Teil des Kurses
<Kurs>Predictive Analytics mit vernetzten Daten in R</Kurs>Übungsanweisungen
- Berechne die Churn-Wahrscheinlichkeit jedes Kunden,
churnProb, mit dem relational neighbor classifier. - Nutze
which(), um die Kunden mit der höchsten Churn-Wahrscheinlichkeit zu finden. Nenne diesen VektormostLikelyChurners. - Verwende
mostLikelyChurners, um die IDs der Kunden mit der höchsten Churn-Wahrscheinlichkeit zu ermitteln.
Interaktive praktische Übung
Versuche dich an dieser Übung, indem du diesen Beispielcode vervollständigst.
# Compute the churn probabilities
churnProb <- ___ / (ChurnNeighbors + ___)

# Find who is most likely to churn
mostLikelyChurners <- which(churnProb == ___(churnProb))

# Extract the IDs of the most likely churners
customers$id[___]