Train/Test-Verteilungen
In einem Machine-Learning-Interview wirst du mit ziemlich hoher Wahrscheinlichkeit mit Trainings- und Testdaten arbeiten. Wie zuvor besprochen, kann die Modellleistung leiden, wenn sich die Verteilungen der Trainings- und Testdatensätze unterscheiden.
In dieser Übung verwendest du Funktionen aus sklearn.model_selection sowie seaborn und matplotlib.pyplot, um loan_data in ein Trainings- und ein Testset aufzuteilen und deren Verteilungen zu visualisieren, um mögliche Abweichungen zu erkennen.
Beachte, dass seaborn und matplotlib.pyplot bereits importiert und als sns bzw. plt aliasiert wurden.
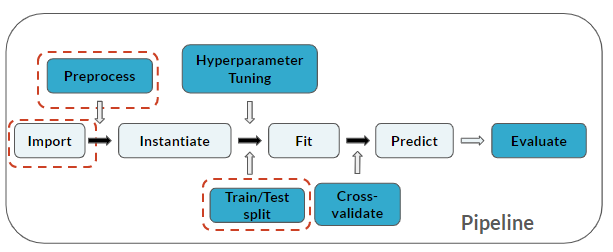
Die Pipeline umfasst jetzt den Schritt Train/Test split:
Diese Übung ist Teil des Kurses
<Kurs>ML-Vorstellungsgespräche in Python üben</Kurs>Übungsanweisungen
- Bilde aus
loan_dataeine Teilmenge nur mit den MerkmalenCredit ScoreundAnnual Incomesowie der ZielvariablenLoan Status– in genau dieser Reihenfolge. - Erstelle eine 80/20-Aufteilung von
loan_dataund weise sieloan_data_subsetzu. - Erstelle Pairplots von
trainingSetundtestSet(in genau dieser Reihenfolge) und setze das Argumenthueauf die ZielvariableLoan Status.
Interaktive praktische Übung
Versuche dich an dieser Übung, indem du diesen Beispielcode vervollständigst.
# Create `loan_data` subset: loan_data_subset
loan_data_subset = ____[['____','____','____']]

# Create train and test sets
trainingSet, testSet = ____(____, ____=___, random_state=123)

# Examine pairplots
plt.figure()
sns.____(____, hue='____', palette='RdBu')
plt.show()

plt.figure()
sns.____(____, hue='____', palette='RdBu')
plt.show()