Interpretation von Predictor-Insight-Grafiken
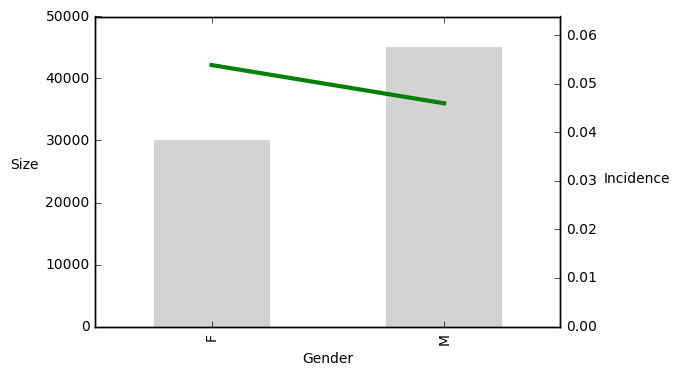
Betrachte die Predictor-Insight-Grafik, die den Zusammenhang zwischen der Zielinzidenz und dem Geschlecht (M - männlich, F - weiblich) der potenziellen Spenderin oder des potenziellen Spenders zeigt. Die Balken zeigen die Größe der Gruppen, die Linie zeigt die prozentualen Zielwerte.
Diese Übung ist Teil des Kurses
<Kurs>Einführung in Predictive Analytics mit Python</Kurs>Interaktive praktische Übung
Verwandle Theorie mit einer unserer interaktiven Übungen in die Praxis
 Übung starten