Die Lift-Kurve interpretieren
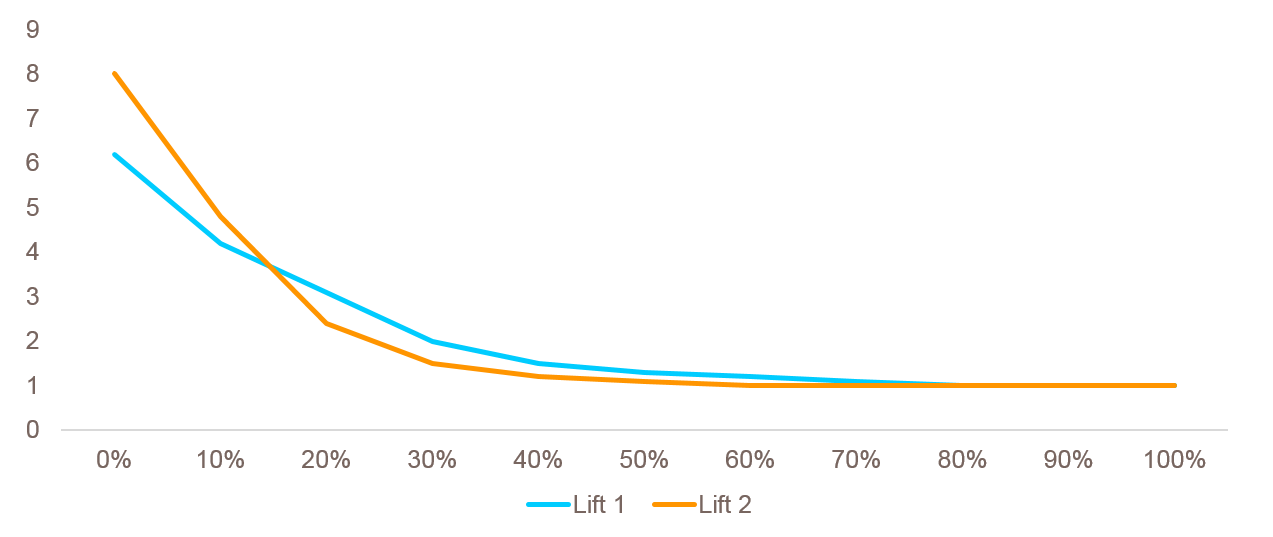
Unten siehst du die Lift-Kurven zweier Modelle, die vorhersagen, welche Spenderinnen und Spender mit hoher Wahrscheinlichkeit für eine bestimmte Kampagne spenden. Angenommen, du hast Budget, um 20 % der Spender anzusprechen. Welches Modell solltest du verwenden? Denk daran: Die Lift-Kurve zeigt, um wie viel Mal mehr als im Durchschnitt das Modell Ziele erreicht, wenn man denjenigen Prozentsatz der Bevölkerung betrachtet, der laut Modell am ehesten ein Ziel ist.
Diese Übung ist Teil des Kurses
<Kurs>Einführung in Predictive Analytics mit Python</Kurs>Interaktive praktische Übung
Verwandle Theorie mit einer unserer interaktiven Übungen in die Praxis
 Übung starten