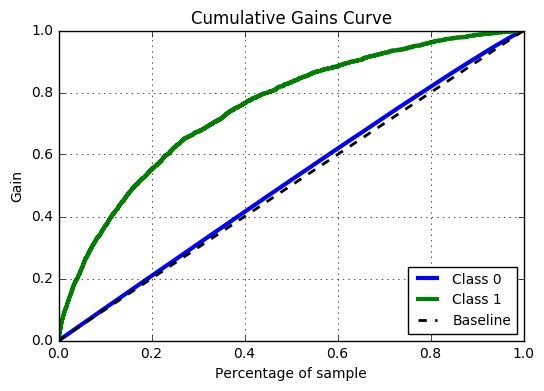
Die kumulative Gewinnkurve interpretieren
Du hast ein Modell gebaut, das vorhersagt, welche Spender am ehesten auf eine Kampagne reagieren, und dazu die unten abgebildete kumulative Gewinnkurve erstellt. Angenommen, du hast Budget, um einen Brief an die Top 30 000 Spender von insgesamt 100 000 zu senden. Wie viele Targets (Spender, die reagieren) wirst du erreichen, wenn es unter den 100 000 Spendern 5 000 Targets gibt? Erinnere dich: Die kumulative Gewinnkurve zeigt für jeden x-Wert auf der horizontalen Achse den Prozentsatz der Targets, die mit dem Modell erreicht werden.
Diese Übung ist Teil des Kurses
<Kurs>Einführung in Predictive Analytics mit Python</Kurs>Interaktive praktische Übung
Verwandle Theorie mit einer unserer interaktiven Übungen in die Praxis
 Übung starten