Influence of the prior & data on the posterior
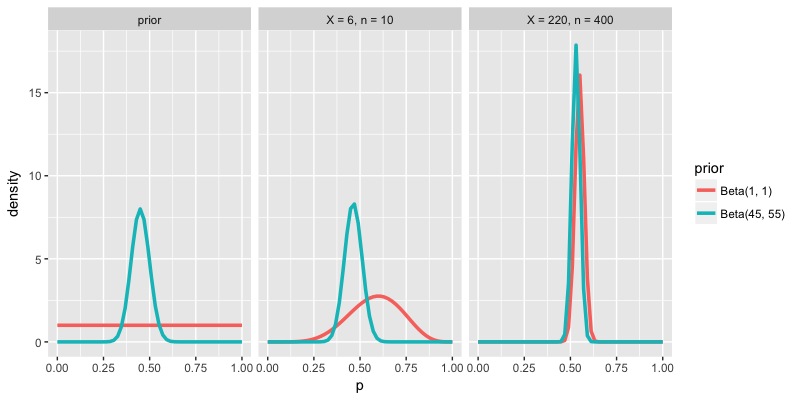
Examine the density plots below. The first set of density plots illustrates 2 potential priors for your underlying support \(p\). The other 2 sets of density plots illustrate the posterior models for \(p\) that evolve from these different priors and different polling data \(X\) and \(n\). Which of the following best describes the combined influence of the prior and data on the posterior?
This exercise is part of the course
Bayesian Modeling with RJAGS
Hands-on interactive exercise
Turn theory into action with one of our interactive exercises
 Start Exercise