侧边栏布局
布局函数用于在 UI 中对输入和输出进行可视化排列。合理的布局不仅能让 Shiny 应用更美观,也能提升用户体验。
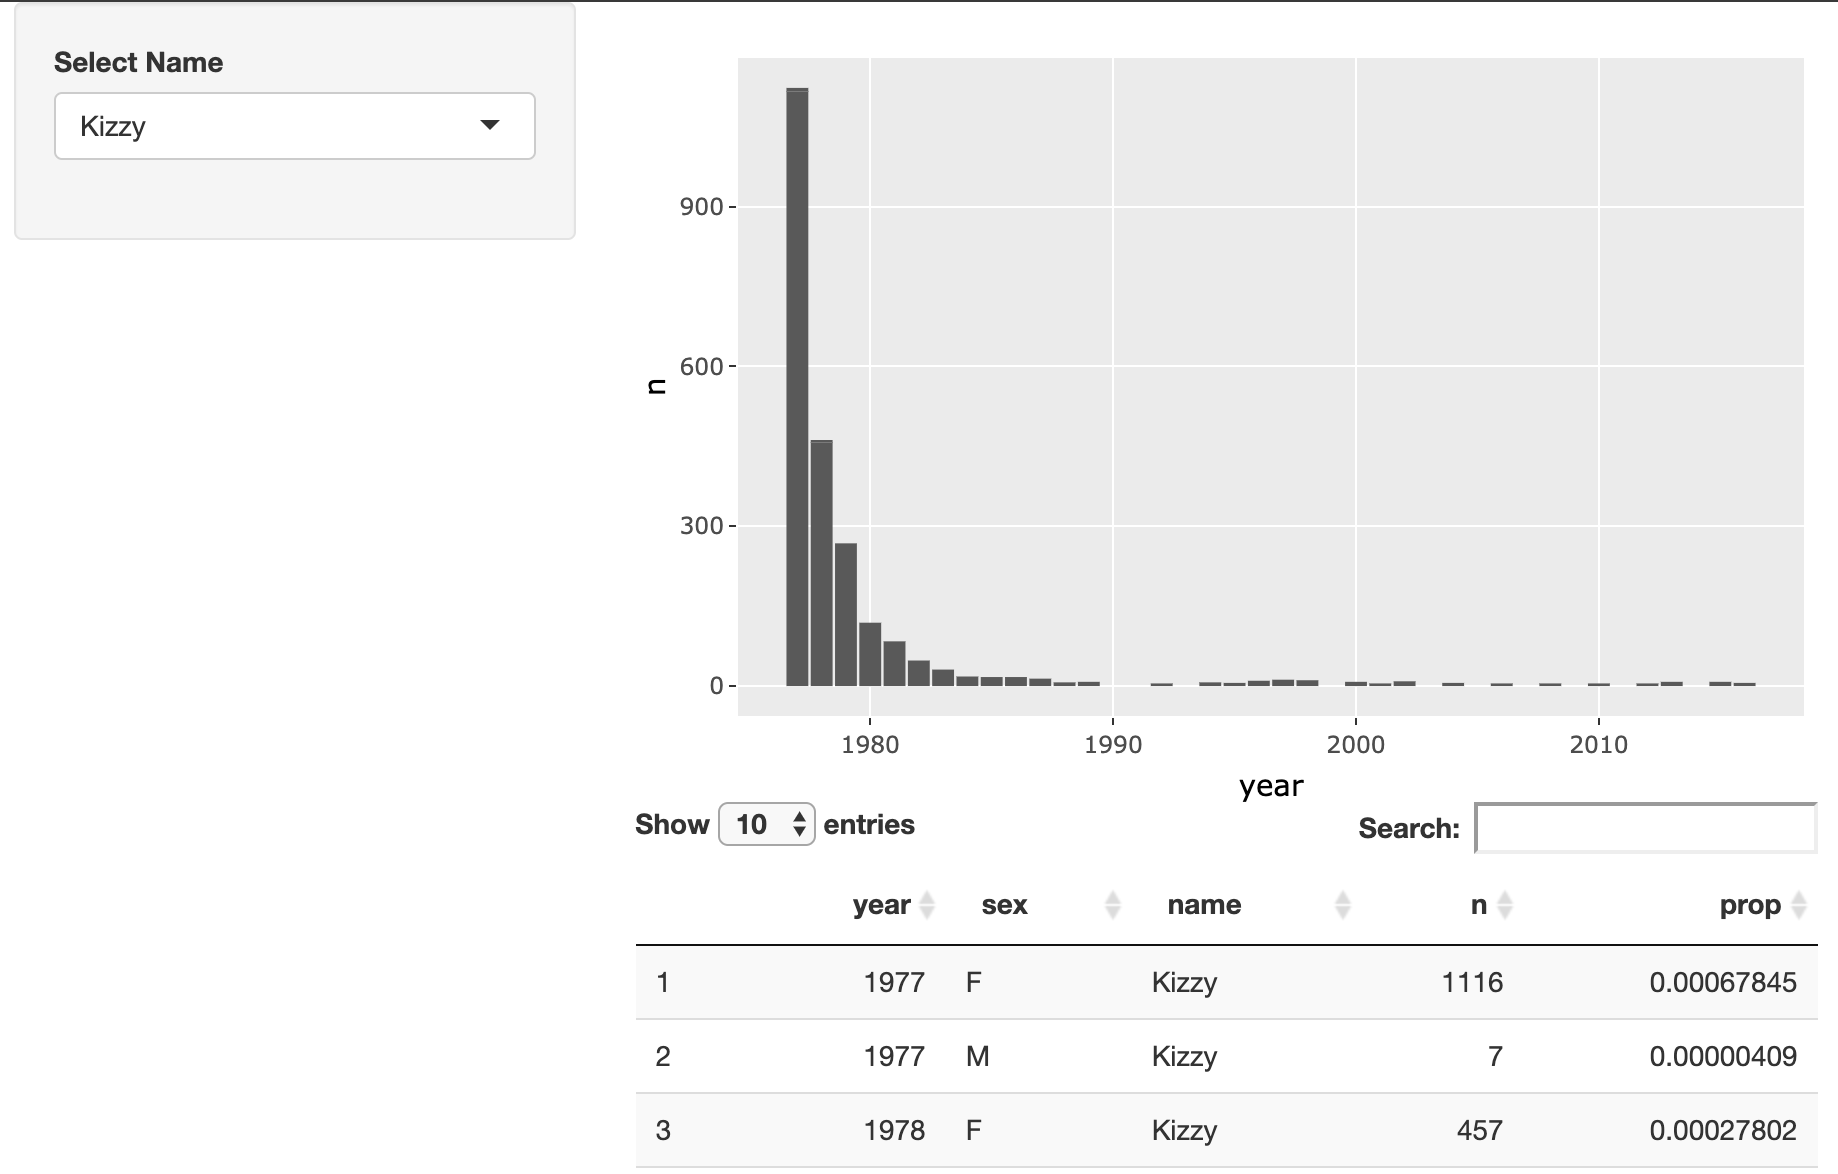
在本练习中,您将修改一个 Shiny 应用的布局,该应用用于探索流行名字的热度趋势。最终的应用应在外观上与下图相似:
本练习是课程的一部分
使用 R 构建 Shiny Web 应用
练习说明
- 修改此应用的布局,使名字选择器显示在侧边栏,图表和表格显示在右侧。
交互式实操练习
通过完成这段示例代码来试试这个练习。
ui <- fluidPage(
  # MODIFY CODE BELOW: Wrap in a sidebarLayout
    # MODIFY CODE BELOW: Wrap in a sidebarPanel
    selectInput('name', 'Select Name', top_trendy_names$name),
    # MODIFY CODE BELOW: Wrap in a mainPanel
    plotly::plotlyOutput('plot_trendy_names'),
    DT::DTOutput('table_trendy_names')
)

# DO NOT MODIFY
server <- function(input, output, session){
  # Function to plot trends in a name
  plot_trends <- function(){
     babynames %>%
      filter(name == input$name) %>%
      ggplot(aes(x = year, y = n)) +
      geom_col()
  }
  output$plot_trendy_names <- plotly::renderPlotly({
    plot_trends()
  })

  output$table_trendy_names <- DT::renderDT({
    babynames %>%
      filter(name == input$name)
  })
}

shinyApp(ui = ui, server = server)