探索 2014 年科技行业心理健康调查
别被吓到,在本练习中,您将一次性构建完整的应用(不含自定义错误消息)!
这个应用将把以下两个问题作为可多选的输入组件:"您认为与雇主讨论心理健康问题会带来负面后果吗?"(变量 mental_health_consequence)以及"您觉得雇主对心理健康的重视程度是否与身体健康一样?"(mental_vs_physical)。随后,将展示受访者 Age 的直方图。要查看这些变量可选项,请在控制台对它们使用 count()。
请回忆,完成后应用将如下所示(包括空白图):
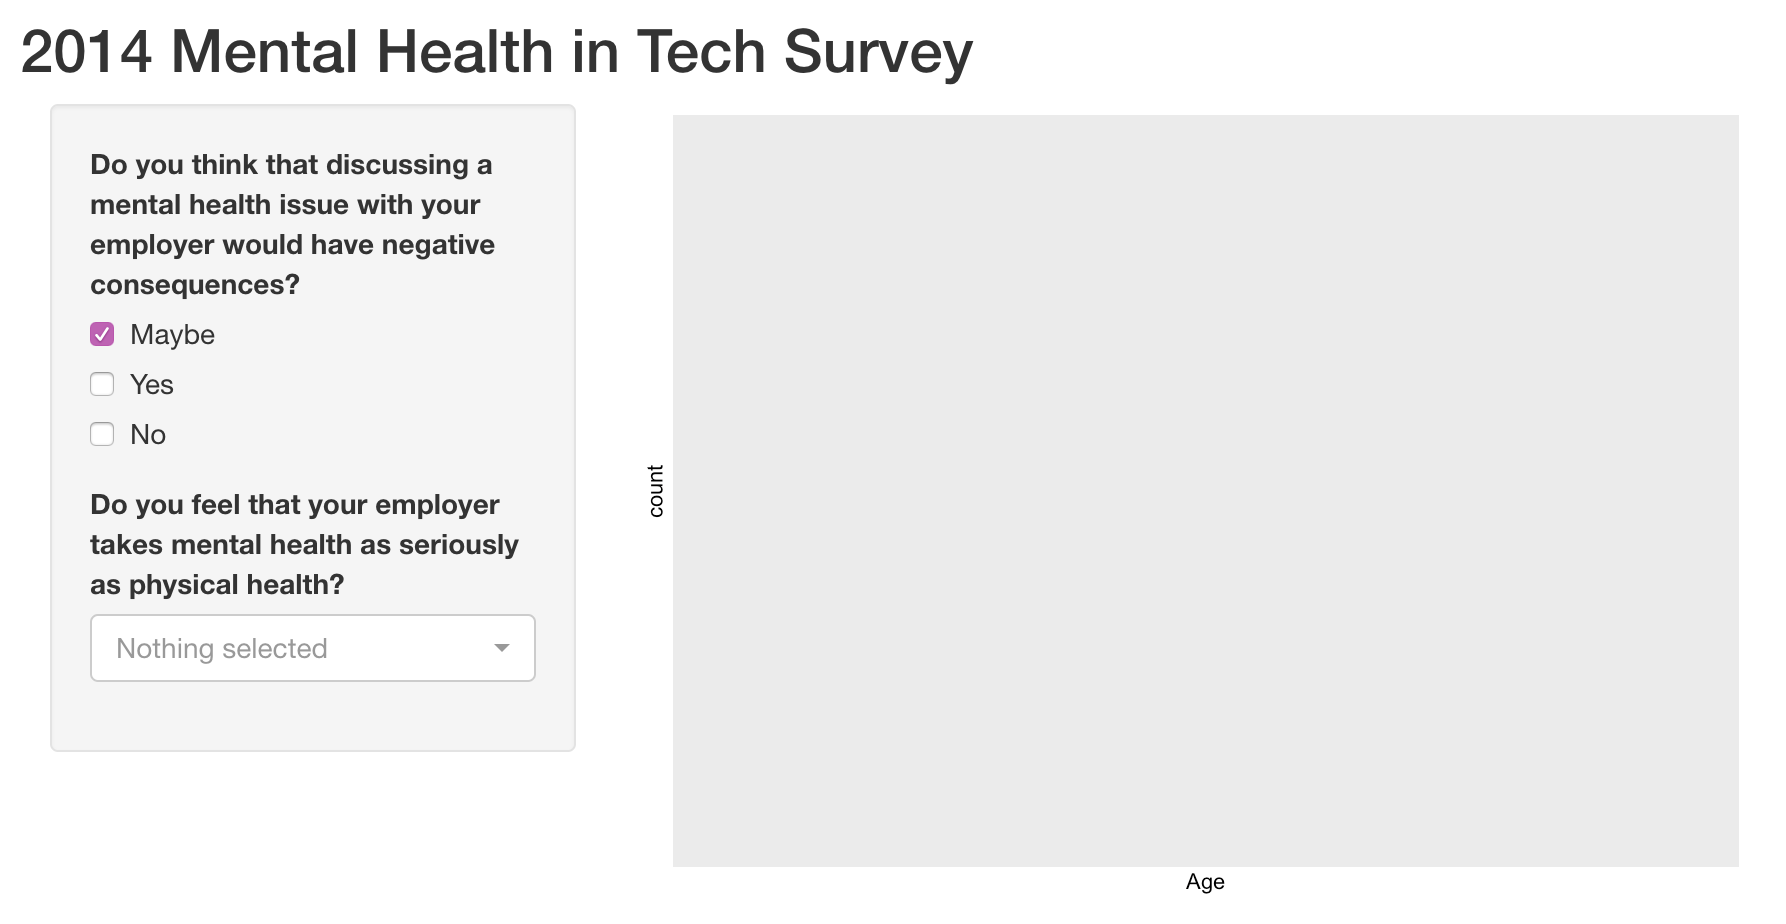
shiny、ggplot2、dplyr 以及 mental_health_survey 数据集均已为您加载。
本练习是课程的一部分
使用 R 构建 Shiny Web 应用
练习说明
- UI:
- 为应用添加合适的标题。
- 添加一个
checkboxGroupInput()。为selected参数设置一个默认值。 - 添加一个
pickerInput(),并将multiple参数设为TRUE。 - 在主面板中添加一个
plotOutput()。
- Server:
- 添加一个输出,显示受两项输入筛选后的受访者
Age的直方图。
- 添加一个输出,显示受两项输入筛选后的受访者
交互式实操练习
通过完成这段示例代码来试试这个练习。
ui <- fluidPage(
  # CODE BELOW: Add an appropriate title

  sidebarPanel(
  	# CODE BELOW: Add a checkboxGroupInput


  	# CODE BELOW: Add a pickerInput


  ),
  mainPanel(
	# CODE BELOW: Display the output

  )
)

server <- function(input, output, session) {
  # CODE BELOW: Build a histogram of the age of respondents
  # Filtered by the two inputs


}

shinyApp(ui, server)