探索各菜系:高频配料
美食具有普遍吸引力。利用多种多样的食材可以搭配出令人惊叹的菜肴,几乎有无限的变化!在本练习中,您将使用名为 recipes 的数据集。它包含菜谱、所属的菜系,以及所用的配料。您的任务是构建一个 Shiny 应用,让用户按菜系探索最常用的配料。
最终的应用应与此截图中的界面类似。
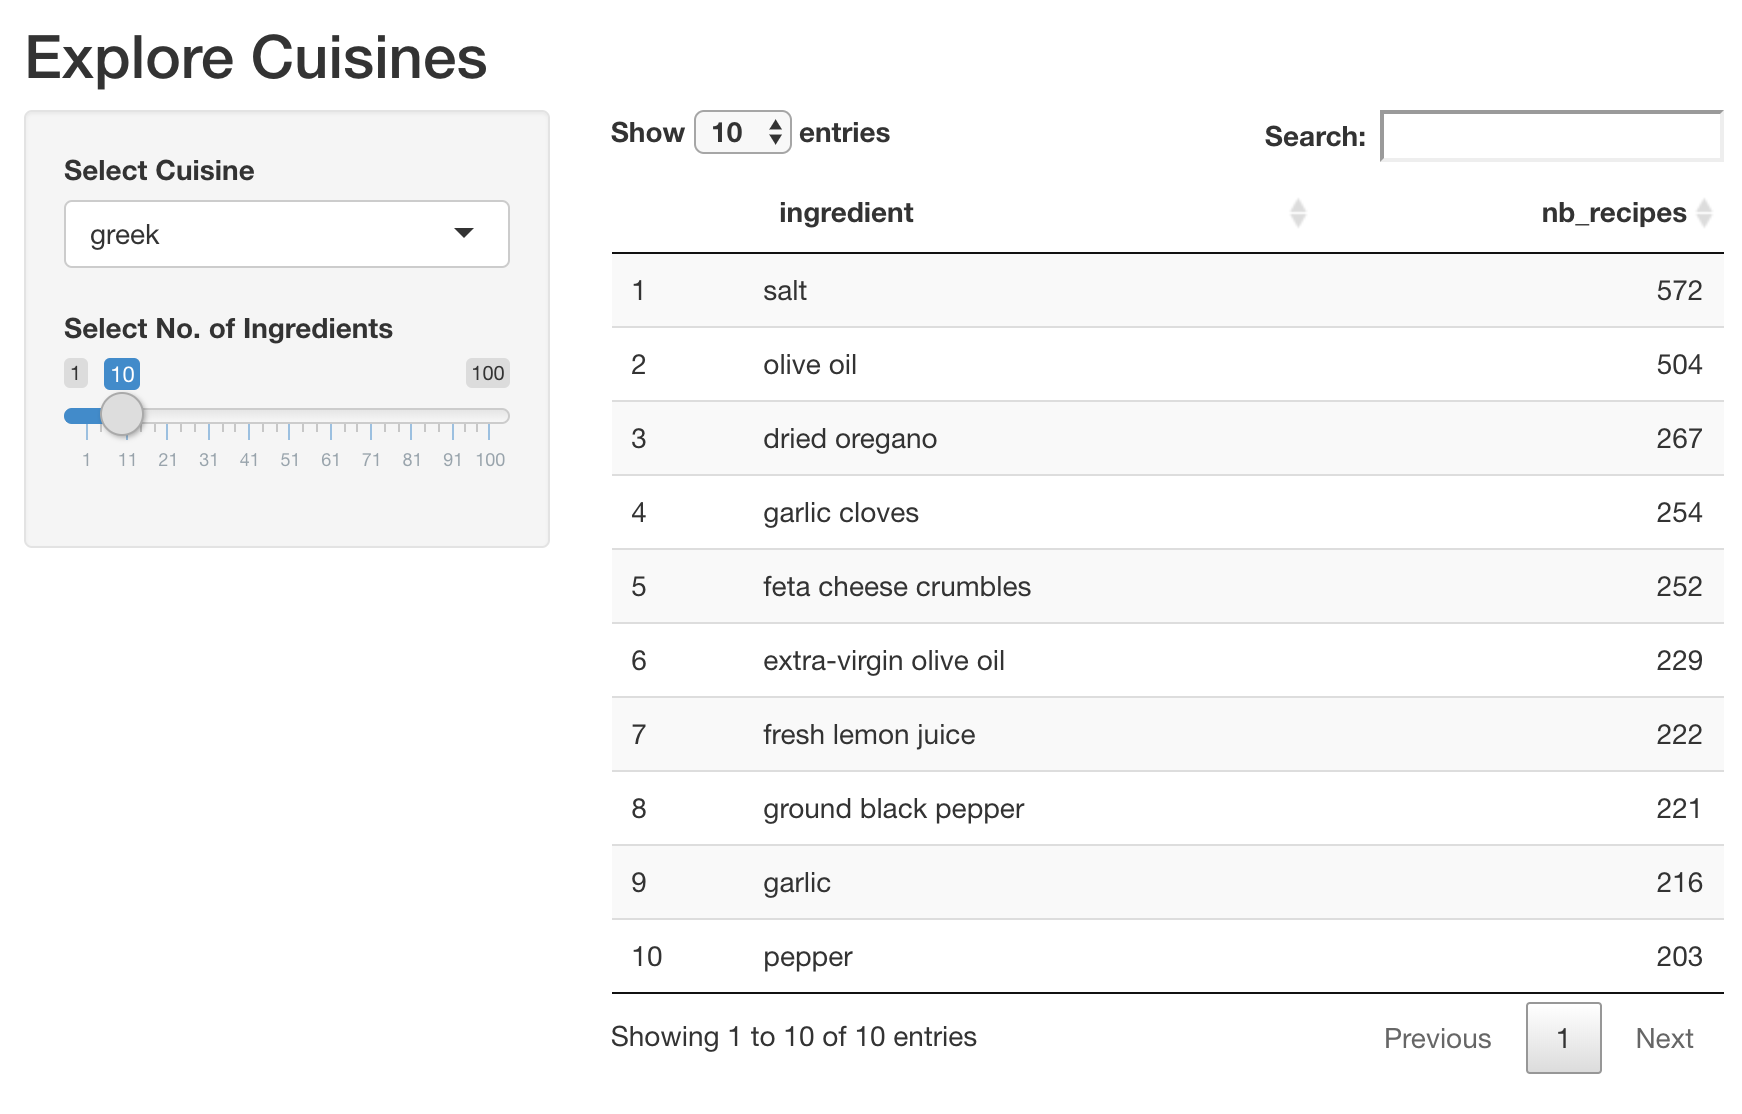
我们已经为您加载了 shiny 和 dplyr 包,以及数据集 recipes。此外,这里有一段便捷代码,可以获取希腊菜中使用频率最高的 10 种配料。根据用户选择的菜系和配料数量,您可以据此在应用中创建交互式数据表。
recipes %>%
  filter(cuisine == 'greek') %>%
  count(ingredient, name = 'nb_recipes') %>%
  arrange(desc(nb_recipes)) %>%
  head(10)
本练习是课程的一部分
使用 R 构建 Shiny Web 应用
练习说明
- UI:
- 在侧边栏添加名为
cuisine的输入,让用户从recipes数据集中可用的全部菜系中进行选择。 - 在侧边栏添加名为
nb_ingredients的滑块输入,让用户选择需要显示的配料数量。 - 在主面板添加一个名为
dt_top_ingredients的交互式数据表输出。
- 在侧边栏添加名为
- Server:
- 基于所选菜系和需要显示的高频配料数量筛选
recipes。 - 将筛选后的数据渲染为交互式数据表。
- 将其赋给名为
dt_top_ingredients的输出对象。
- 基于所选菜系和需要显示的高频配料数量筛选
交互式实操练习
通过完成这段示例代码来试试这个练习。
ui <- fluidPage(
  titlePanel('Explore Cuisines'),
  sidebarLayout(
    sidebarPanel(
      # CODE BELOW: Add an input named "cuisine" to select a cuisine

      # CODE BELOW: Add an input named "nb_ingredients" to select # of ingredients

    ),
    mainPanel(
      # CODE BELOW: Add a DT output named "dt_top_ingredients"

    )
  )
)

server <- function(input, output, session) {
  # CODE BELOW: Render the top ingredients in a chosen cuisine as
  # an interactive data table and assign it to output object `dt_top_ingredients`


}

shinyApp(ui, server)