Yordayıcı içgörü grafiklerinin yorumlanması
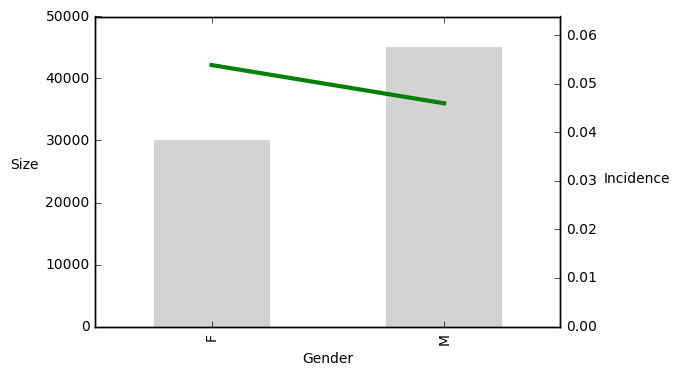
Hedef gerçekleşme oranı ile aday bağışçının cinsiyeti (M - erkek, F - kadın) arasındaki ilişkiyi gösteren yordayıcı içgörü grafiğini düşün. Çubuklar grupların büyüklüğünü, çizgi ise hedef yüzdelerini gösterir.
Bu egzersiz, kursun bir parçasıdır
Python ile Öngörücü Analitiğe Giriş
Uygulamalı etkileşimli egzersiz
Teoriyi etkileşime dönüştürün, interaktif egzersizlerimizden biriyle
 Egzersize başla