Regressão logística não linear
No capítulo 3, você explorou a distância percorrida por quem vai ao trabalho e o efeito linear disso na probabilidade de alguém pegar o ônibus. Mas e se essa relação for não linear e não monotônica?
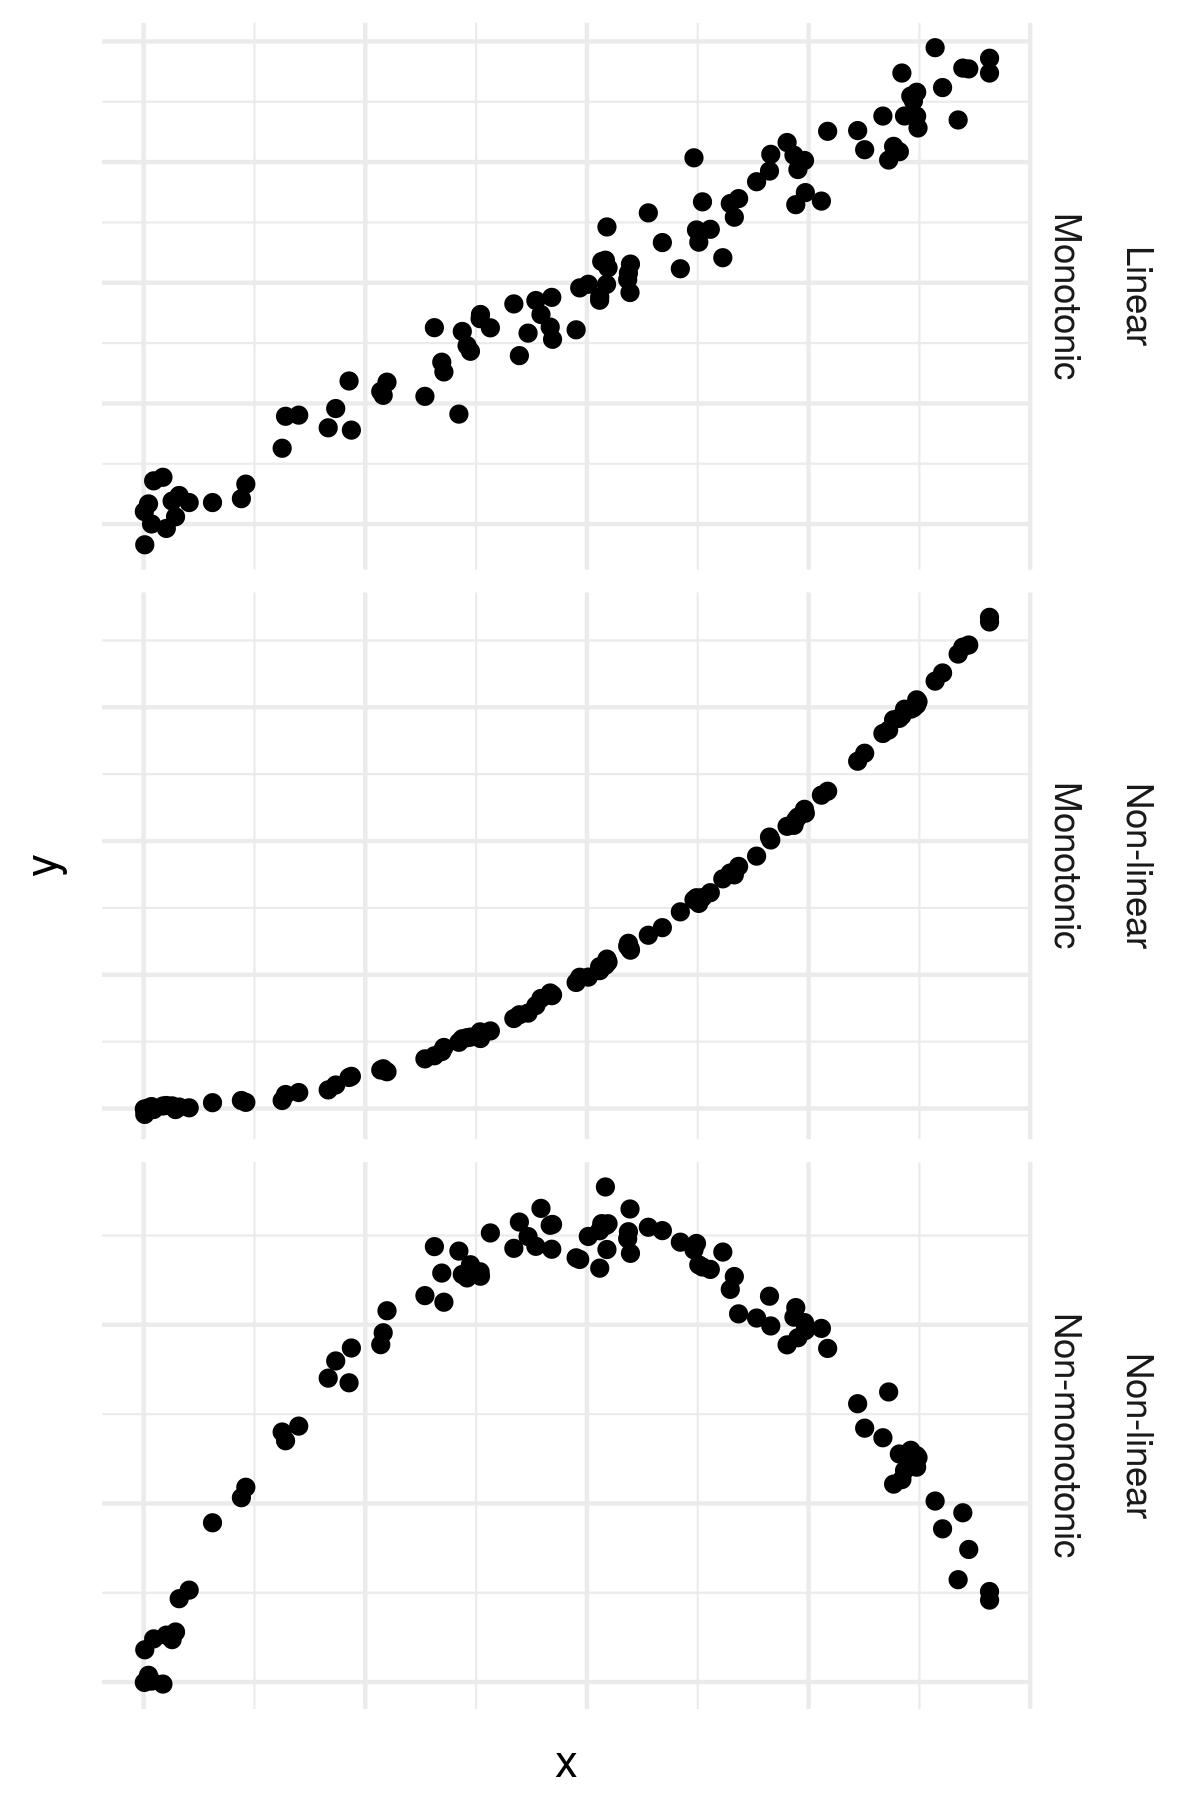
Por exemplo, e se pessoas que fazem os percursos mais curtos e os mais longos forem menos propensas a pegar o ônibus?
Você pode adicionar termos não lineares às fórmulas em R usando a função I(..) como parte da sua fórmula.
Por exemplo, y~I(x^2) permite estimar um coeficiente para x*x.
Neste exercício, você vai analisar mais os dados de ônibus.
Este exercicio faz parte do curso
Modelos Lineares Generalizados em R
Instruções do exercicio
- Adicione a fórmula
y ~ I(x^2)à opçãoformulana segunda chamada degeom_smooth().
exercicio interativo prático
Tente este exercicio completando este código de exemplo.
# Plot linear effect of travel distance on probability of taking the bus
gg_jitter <-
	ggplot(data = bus, aes(x = MilesOneWay, y = Bus2)) +
	geom_jitter(width = 0, height = 0.05) +
	geom_smooth(method = 'glm',
                method.args = list(family = 'binomial'))

# Add a non-linear equation to a geom_smooth()
gg_jitter +
	geom_smooth(method = 'glm',
                method.args = list(family = 'binomial'),
                formula = ___,
                color = 'red')