Dendrogram interpreteren
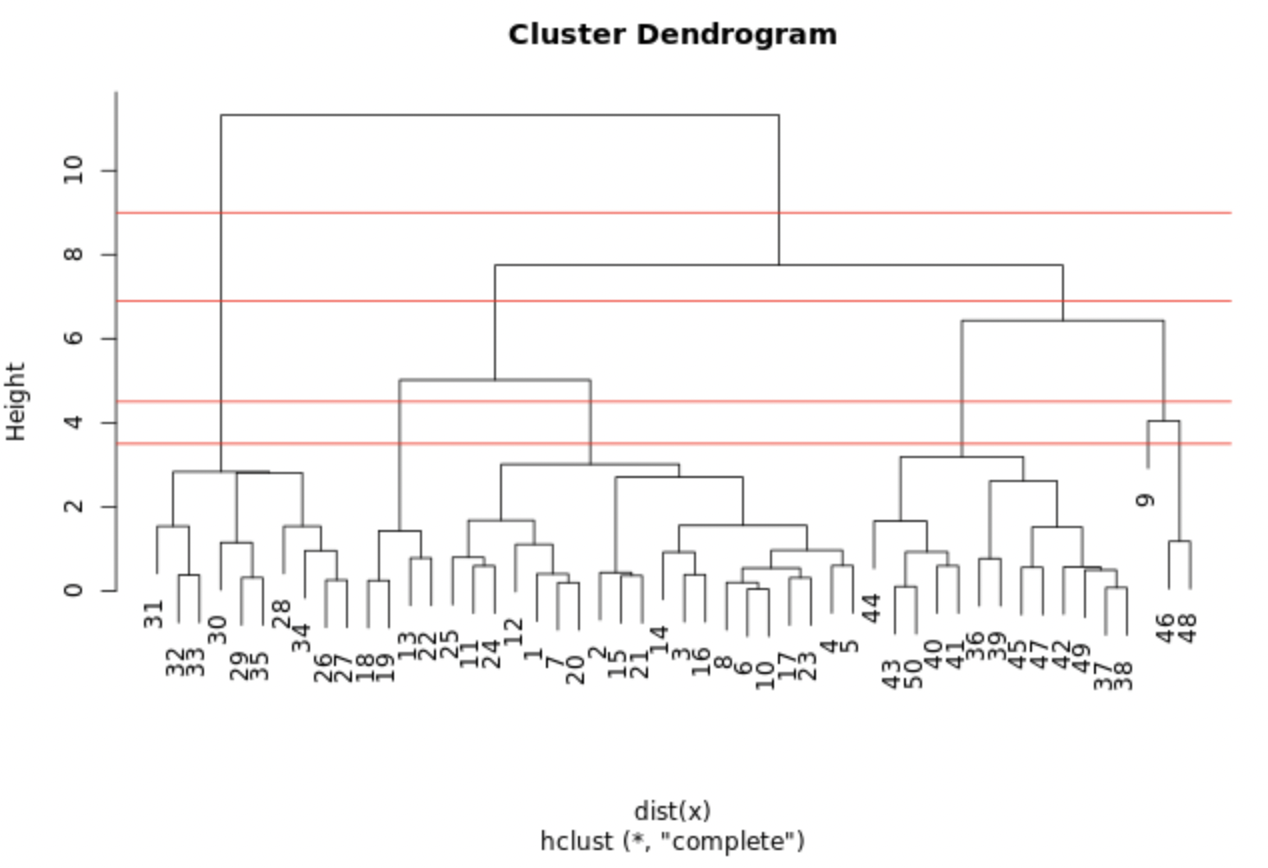
De getoonde plot laat het hclust.out-model zien dat je in de vorige oefening hebt gemaakt. We hebben horizontale lijnen getekend op hoogtes 3,5; 4,5; 6,9 en 9,0.
Welke afkaphoogte levert 3 clusters op?
Deze oefening maakt deel uit van de cursus
Unsupervised learning in R
Interactieve oefening met praktijkervaring
Zet theorie om in actie met een van onze interactieve oefeningen
 Begin oefening