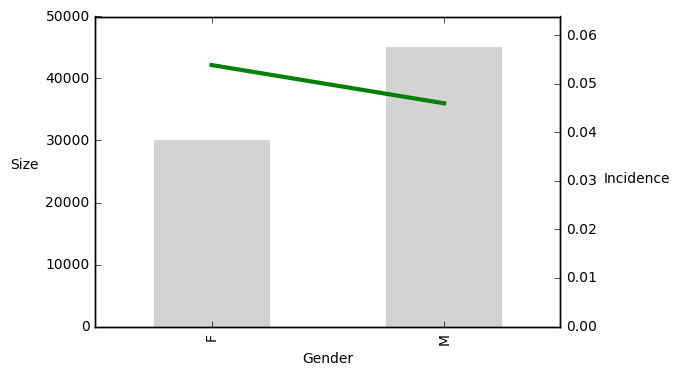
Interpretatie van predictor-insightgrafieken
Kijk naar de predictor-insightgrafiek die de relatie laat zien tussen de target-incidentie en het geslacht (M - man, F - vrouw) van de potentiële donateur. De balken geven de grootte van de groepen aan, de lijn geeft het percentage targets weer.
Deze oefening maakt deel uit van de cursus
Introductie tot Predictive Analytics in Python
Interactieve oefening met praktijkervaring
Zet theorie om in actie met een van onze interactieve oefeningen
 Begin oefening