De lift-curve interpreteren
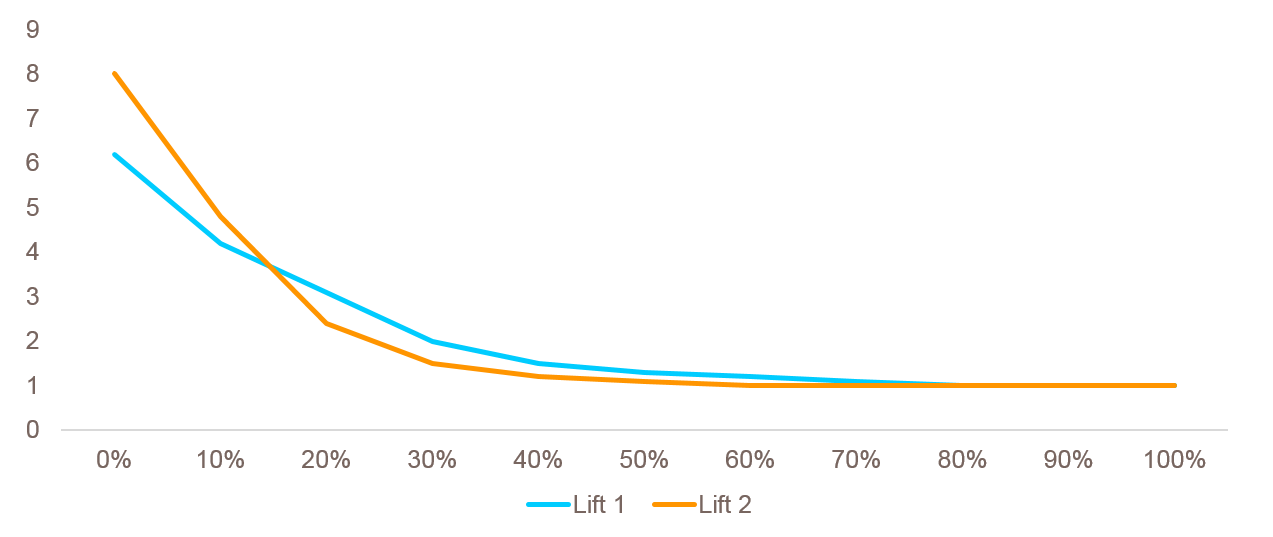
Hieronder zie je de lift-curves van twee modellen die voorspellen welke donateurs het meest waarschijnlijk doneren voor een bepaalde campagne. Ga ervan uit dat je budget hebt om 20% van de donateurs te benaderen. Welk model gebruik je? Onthoud dat de lift-curve aangeeft hoeveel keer meer dan gemiddeld het model targets bereikt wanneer je een gegeven percentage van de populatie neemt die volgens het model het meest waarschijnlijk target is.
Deze oefening maakt deel uit van de cursus
Introductie tot Predictive Analytics in Python
Interactieve oefening met praktijkervaring
Zet theorie om in actie met een van onze interactieve oefeningen
 Begin oefening