Creare un elenco puntato
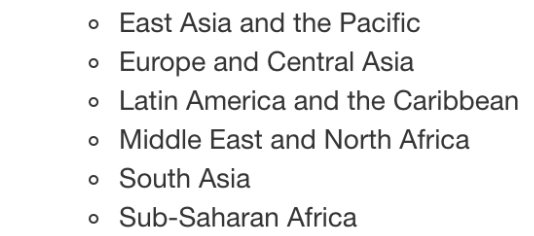
In precedenza, hai imparato ad aggiungere testo al tuo file Markdown per includere informazioni aggiuntive per il tuo pubblico. Ora creerai un elenco puntato per indicare quali regioni sono incluse nei dati investment_annual_summary. Fai riferimento all’immagine qui sotto dal video per ricordare l’elenco delle regioni che dovrebbero essere incluse nella tua tabella.
Questo esercizio fa parte del corso
Reportistica con R Markdown
Istruzioni dell'esercizio
- Aggiungi al report, a partire dalla riga
27, un elenco puntato con ciascuna delle regioni incluse nei dati: East Asia and the Pacific, Europe and Central Asia, Latin America and the Caribbean, Middle East and North Africa, South Asia e Sub-Saharan Africa.
esercizio interattivo pratico
Prova questo esercizio completando questo codice di esempio.
{"investment_report.Rmd":"---\ntitle: \"Investment Report\"\ndate: \"`r format(Sys.time(), '%d %B %Y')`\"\noutput: html_document\n---\n\n```{r setup, include = FALSE}\nknitr::opts_chunk$set(fig.align = 'center', echo = TRUE)\n```\n\n```{r data, include = FALSE}\nlibrary(readr)\nlibrary(dplyr)\nlibrary(ggplot2)\n\ninvestment_annual_summary <- read_csv(\"https://assets.datacamp.com/production/repositories/5756/datasets/d0251f26117bbcf0ea96ac276555b9003f4f7372/investment_annual_summary.csv\")\ninvestment_region_summary <- read_csv(\"https://assets.datacamp.com/production/repositories/5756/datasets/52f5414f6504e0503e86eb1043afa9b3d157fab2/investment_region_summary.csv\")\ninvestment_services_projects <- read_csv(\"https://assets.datacamp.com/production/repositories/5756/datasets/bcb2e39ecbe521f4b414a21e35f7b8b5c50aec64/investment_services_projects.csv\")\n```\n\n\n## Datasets \n### Investment Annual Summary\nThe `investment_annual_summary` dataset provides a summary of the dollars in millions provided to each of the following regions for each fiscal year, from 2012 to 2018:\n\n\n\n\n\n\n\n\n```{r investment-annual-summary, out.width = '85%', fig.cap = 'Figure 1.1 The Investment Annual Summary for each region for 2012 to 2018.'}\nggplot(investment_annual_summary, aes(x = fiscal_year, y = dollars_in_millions, color = region)) +\n geom_line() +\n labs(\n title = \"Investment Annual Summary\",\n x = \"Fiscal Year\",\n y = \"Dollars in Millions\"\n )\n```\n\n### Investment Projects in Brazil\nThe `investment_services_projects` dataset provides information about each investment project from 2012 to 2018. Information listed includes the project name, company name, sector, project status, and investment amounts.\n\n```{r brazil-investment-projects, out.width = '95%', fig.cap = 'Figure 1.2 The Investment Services Projects in Brazil from 2012 to 2018.'}\nbrazil_investment_projects <- investment_services_projects %>%\n filter(country == \"Brazil\") \n\nggplot(brazil_investment_projects, aes(x = date_disclosed, y = total_investment, color = status)) +\n geom_point() +\n labs(\n title = \"Investment Services Projects in Brazil\",\n x = \"Date Disclosed\",\n y = \"Total IFC Investment in Dollars in Millions\"\n )\n```\n\n### Investment Projects in Brazil in 2018\nThe `investment_services_projects` dataset was filtered below to focus on information about each investment project from the 2018 fiscal year, and is referred to as `brazil_investment_projects_2018`. \n\n```{r brazil-investment-projects-2018, out.width = '95%', fig.cap = 'Figure 1.3 The Investment Services Projects in Brazil in 2018.'}\nbrazil_investment_projects_2018 <- investment_services_projects %>%\n filter(country == \"Brazil\",\n date_disclosed >= \"2017-07-01\",\n date_disclosed <= \"2018-06-30\") \n\nggplot(brazil_investment_projects_2018, aes(x = date_disclosed, y = total_investment, color = status)) +\n geom_point() +\n labs(\n title = \"Investment Services Projects in Brazil in 2018\",\n x = \"Date Disclosed\",\n y = \"Total IFC Investment in Dollars in Millions\"\n ) \n```\n\n\n"}