Interpretazione dei predictor insight graph
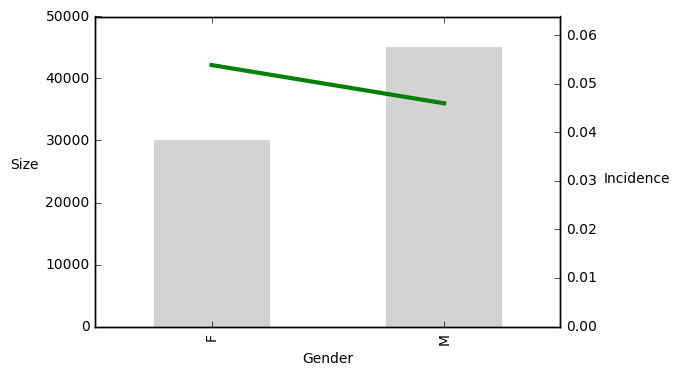
Considera il predictor insight graph che mostra la relazione tra l’incidenza del target e il genere (M - maschio, F - femmina) del potenziale donatore. Le barre indicano la dimensione dei gruppi, la linea indica la percentuale di target.
Questo esercizio fa parte del corso
Introduzione alla Predictive Analytics in Python
esercizio interattivo pratico
Trasforma la teoria in pratica con uno dei nostri esercizi interattivi
 Inizia esercizio