Capire le tabelle di contingenza
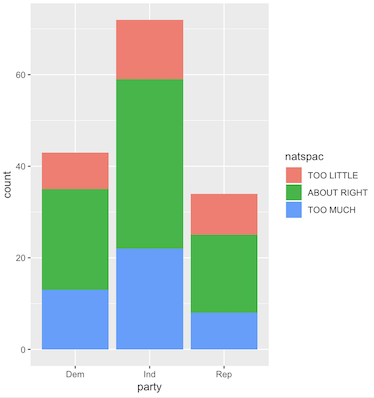
Il bar plot dei conteggi che hai costruito è una rappresentazione visiva di una tabella di contingenza.
Quale delle seguenti affermazioni è FALSA riguardo alle tabelle di contingenza?
Questo esercizio fa parte del corso
Inferenza per dati categorici in R
esercizio interattivo pratico
Trasforma la teoria in pratica con uno dei nostri esercizi interattivi
 Inizia esercizio