Memplot Data
Segala sesuatu di Python adalah objek, bahkan modul. Tujuan Anda dalam latihan ini adalah meninjau penggunaan antarmuka berorientasi objek pada pustaka Python matplotlib untuk memvisualisasikan data terukur dengan alur kerja yang lebih fleksibel dan mudah dikembangkan. Alur kerja pemodelan plot secara umum seperti ini:
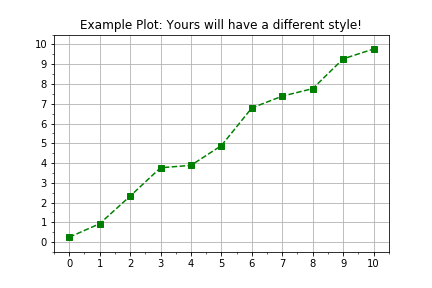
import matplotlib.pyplot as plt
fig, axis = plt.subplots()
axis.plot(x, y, color="green", linestyle="--", marker="s")
plt.show()
Latihan ini merupakan bagian dari kursus
Pengantar Pemodelan Linear di Python
Instruksi latihan
- Gunakan
plt.subplots()untuk membuat objek figure dan axis. - Data telah disediakan dalam dua array
numpyyang sudah didefinisikan, yaitutimesdandistances. - Gunakan
axis.plot()untuk memplottimespada sumbu horizontal dandistancespada sumbu vertikal. - Gunakan argumen kata kunci input
linestyle=" ",marker="o", dancolor="red"saat memanggilaxis.plot().
Latihan interaktif langsung praktik
Cobalah latihan ini dengan melengkapi kode contoh ini.
# Create figure and axis objects using subplots()
fig, axis = plt.____()

# Plot line using the axis.plot() method
line = axis.plot(____ , ____ , linestyle="____", marker="____", color="____")

# Use the plt.show() method to display the figure
plt.____()