Répartition entraînement/test
Lors d’un entretien Machine Learning, vous travaillerez très certainement avec des données d’entraînement et de test. Comme évoqué plus tôt, des performances médiocres peuvent survenir si les distributions des ensembles d’entraînement et de test diffèrent.
Dans cet exercice, vous utiliserez des fonctions de sklearn.model_selection ainsi que seaborn et matplotlib.pyplot pour scinder loan_data en un ensemble d’entraînement et un ensemble de test, puis visualiser leurs distributions afin de repérer d’éventuels écarts.
Notez que seaborn et matplotlib.pyplot ont déjà été importés dans votre environnement et sont aliasés respectivement sns et plt.
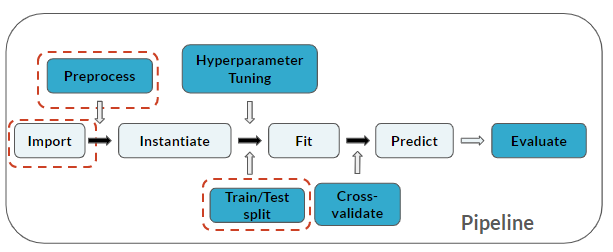
Le pipeline inclut désormais le Train/Test split :
Cet exercice fait partie du cours
<cours>S’entraîner aux questions d’entretien en Machine Learning avec Python</cours>Instructions de l’exercice
- Ne conservez dans
loan_dataque les variables explicativesCredit ScoreetAnnual Income, ainsi que la variable cibleLoan Status— dans cet ordre. - Créez une répartition 80/20 de
loan_dataet affectez-la àloan_data_subset. - Créez des pairplots de
trainingSetpuis detestSet(dans cet ordre) en définissant l’argumenthuesur la variable cibleLoan Status.
Exercice interactif pratique
Essayez cet exercice en complétant ce code d’exemple.
# Create `loan_data` subset: loan_data_subset
loan_data_subset = ____[['____','____','____']]

# Create train and test sets
trainingSet, testSet = ____(____, ____=___, random_state=123)

# Examine pairplots
plt.figure()
sns.____(____, hue='____', palette='RdBu')
plt.show()

plt.figure()
sns.____(____, hue='____', palette='RdBu')
plt.show()