Identifier les dérives pertinentes
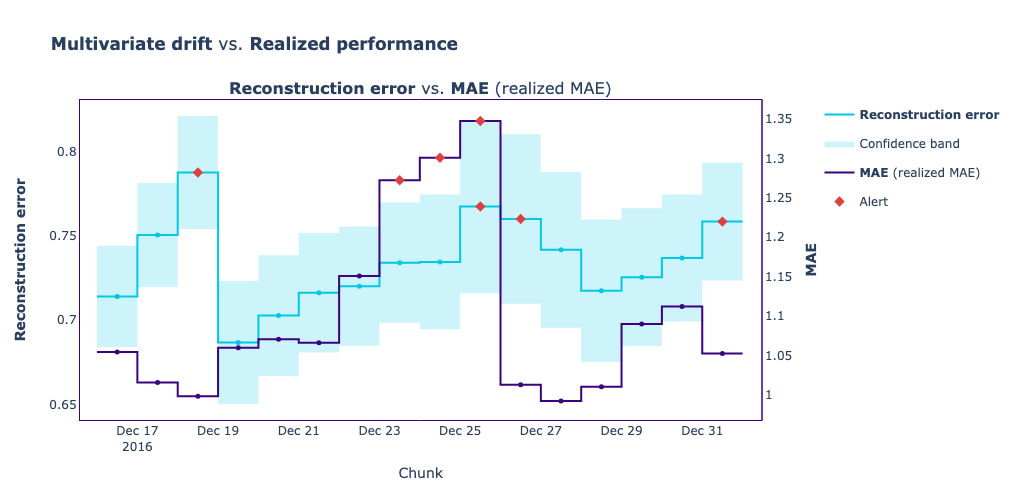
Repensez à l’exemple du jeu de données Green Taxi du chapitre 2, où le modèle prédisait le montant du pourboire. Dans cet exercice, nous avons préparé un graphique comparatif qui montre les valeurs quotidiennes de l’erreur de reconstruction obtenue via la détection de dérive multivariée (en bleu clair), ainsi que la performance réalisée calculée avec la métrique MAE (en bleu foncé).
Votre tâche est d’identifier le jour où une dérive avec alerte coïncide avec une alerte sur la performance du modèle.
Cet exercice fait partie du cours
<cours>Surveiller le Machine Learning en Python</cours>Exercice interactif pratique
Transformez la théorie en action avec l’un de nos exercices interactifs
 Commencer l’exercice