Interpréter les résultats
Dans ce scénario, vous avez déployé avec succès votre algorithme d’estimation des performances en production. Vous disposez donc d’un graphique pour la métrique ROC AUC estimée.
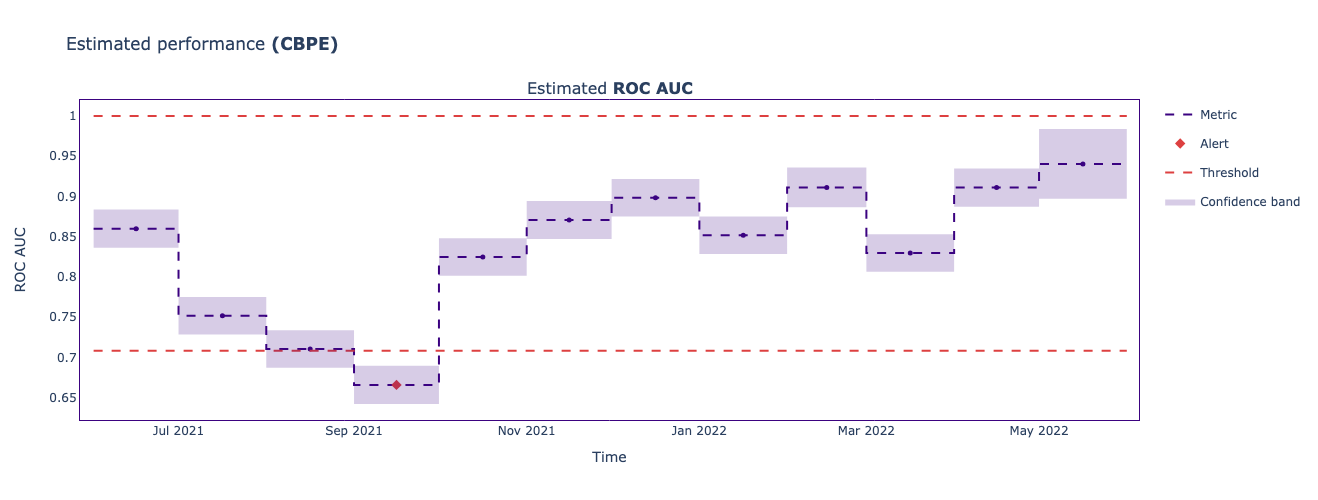
Votre tâche est maintenant de sélectionner, à partir du graphique, les informations correctes concernant :
- la période de lot (chunk) : un point de données unique dans les résultats de surveillance
- le seuil supérieur
- le seuil inférieur
- le nom du mois où une alerte de performance est déclenchée
Cet exercice fait partie du cours
<cours>Surveiller le Machine Learning en Python</cours>Exercice interactif pratique
Transformez la théorie en action avec l’un de nos exercices interactifs
 Commencer l’exercice