Nichtlineare logistische Regression
In Kapitel 3 hast du untersucht, welche Strecke Pendler:innen zurücklegen und welchen linearen Effekt das auf die Wahrscheinlichkeit hat, dass jemand den Bus nimmt. Was aber, wenn dieser Zusammenhang nichtlinear und nicht monoton ist?
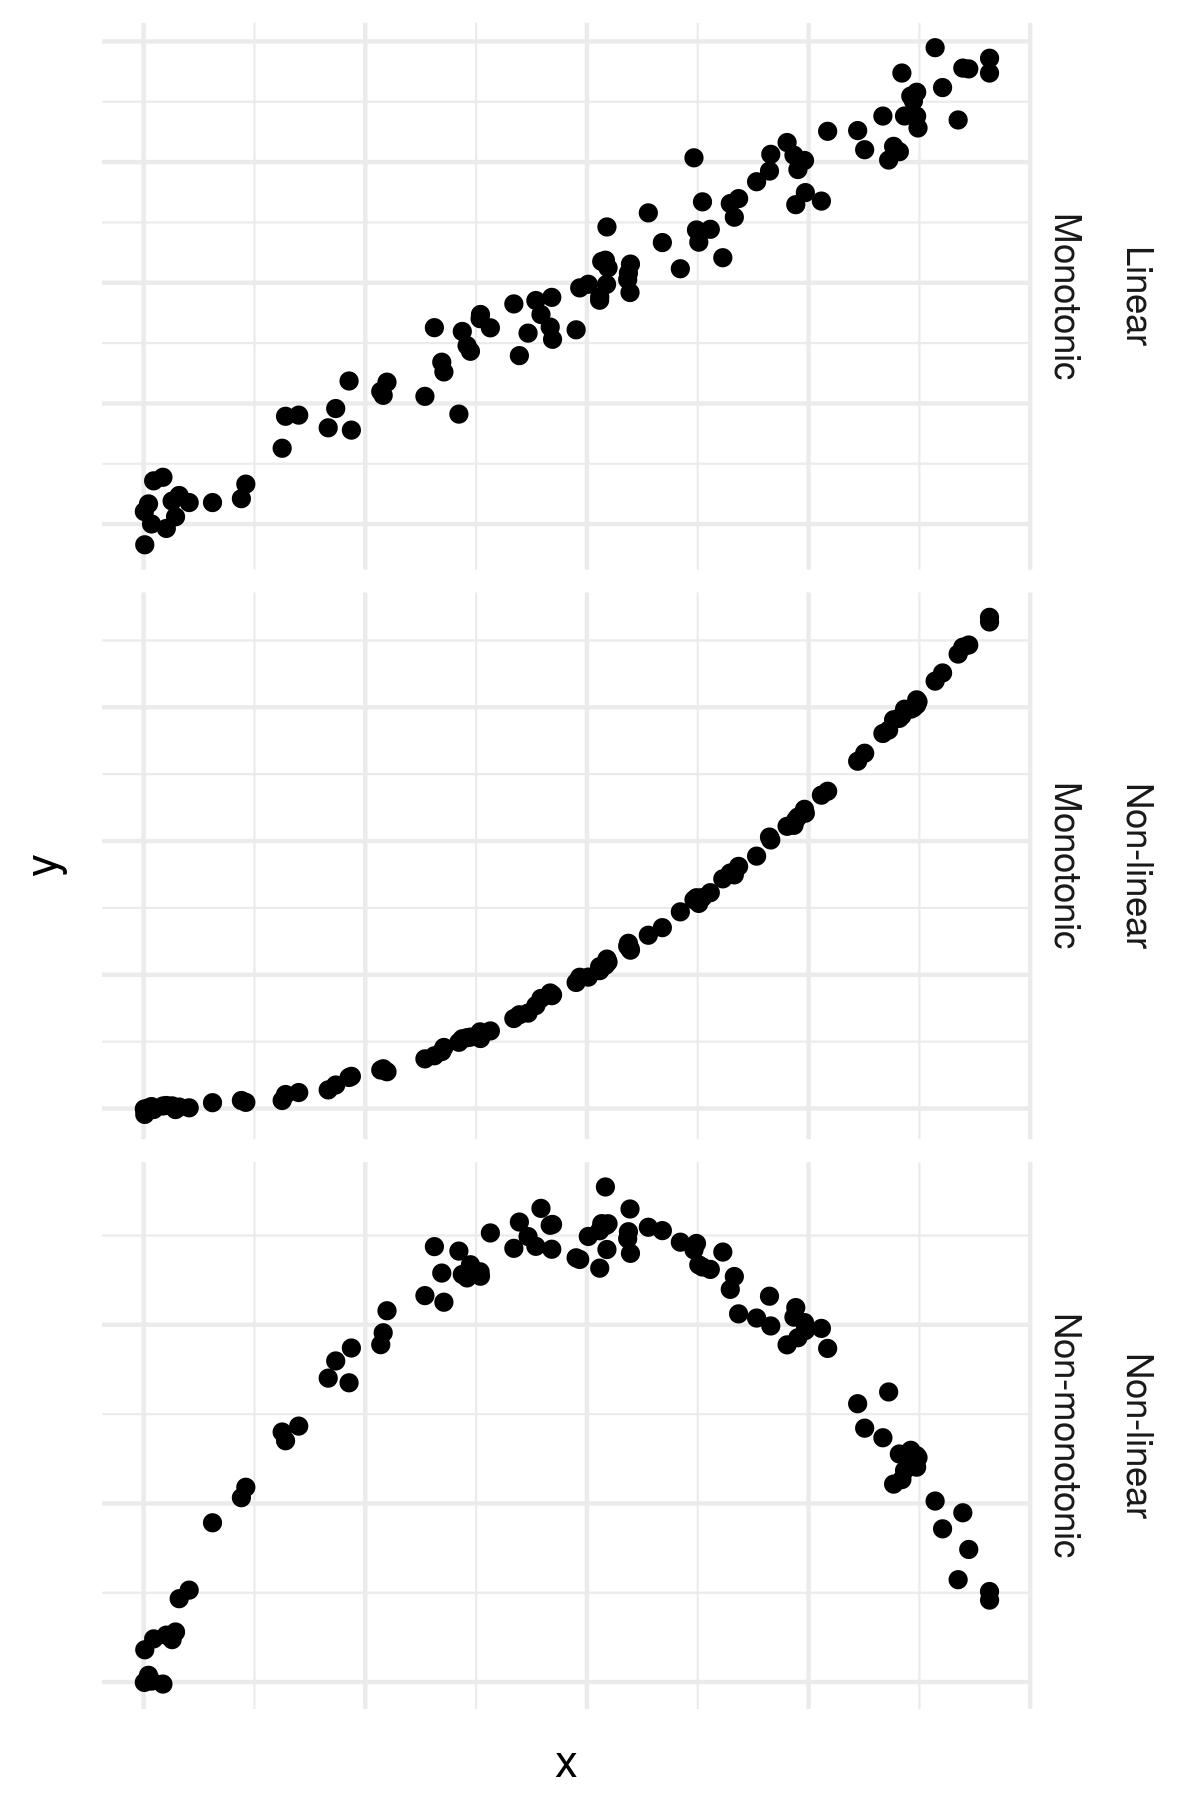
Zum Beispiel: Was, wenn Menschen mit den kürzesten und längsten Arbeitswegen seltener mit dem Bus fahren?
Du kannst in R mithilfe der Funktion I(..) nichtlineare Terme in Formeln aufnehmen.
Zum Beispiel erlaubt dir y~I(x^2), einen Koeffizienten für x*x zu schätzen.
In dieser Übung schaust du dir die Busdaten genauer an.
Diese Übung ist Teil des Kurses
<Kurs>Generalisierte lineare Modelle in R</Kurs>Übungsanweisungen
- Füge die Formel
y ~ I(x^2)zur Optionformulaim zweiten Aufruf vongeom_smooth()hinzu.
Interaktive praktische Übung
Versuche dich an dieser Übung, indem du diesen Beispielcode vervollständigst.
# Plot linear effect of travel distance on probability of taking the bus
gg_jitter <-
	ggplot(data = bus, aes(x = MilesOneWay, y = Bus2)) +
	geom_jitter(width = 0, height = 0.05) +
	geom_smooth(method = 'glm',
                method.args = list(family = 'binomial'))

# Add a non-linear equation to a geom_smooth()
gg_jitter +
	geom_smooth(method = 'glm',
                method.args = list(family = 'binomial'),
                formula = ___,
                color = 'red')