Den mittleren IQ von Zombies nach Gefühl schätzen?
In der letzten Übung hast du die Wahrscheinlichkeit für jede Kombination aus Mittelwert (mu) und Standardabweichung (sigma) berechnet. Mit der Funktion levelplot aus dem Paket lattice können wir diese 2D-Wahkeitsverteilung nun visualisieren:
levelplot(probability ~ mu * sigma, data = pars)
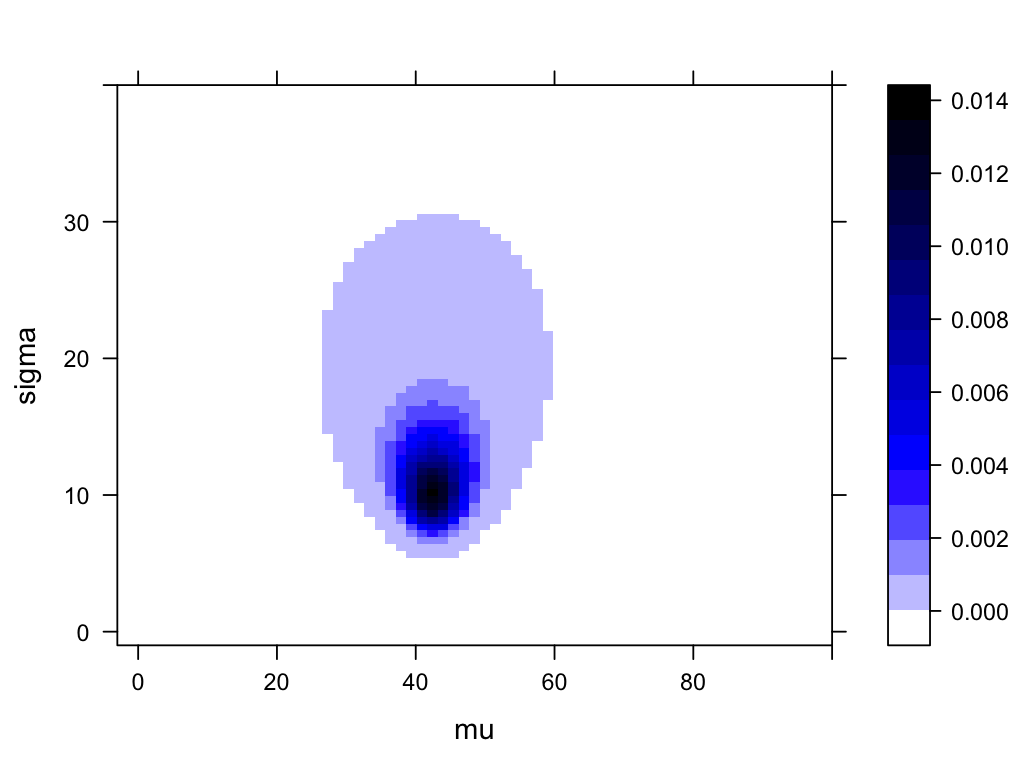
Wir könnten aus dieser Grafik alle möglichen glaubwürdigen Intervalle und Wahrscheinlichkeiten berechnen, aber nur nach Augenmaß:
- Wie hoch ist der wahrscheinlichste Mittelwert (
mu) des Zombie-IQ? Und wie groß ist die Unsicherheit der Schätzung vonmuungefähr?
Diese Übung ist Teil des Kurses
<Kurs>Grundlagen der Bayes'schen Datenanalyse in R</Kurs>Interaktive praktische Übung
Verwandle Theorie mit einer unserer interaktiven Übungen in die Praxis
 Übung starten