Ölçek-konumu
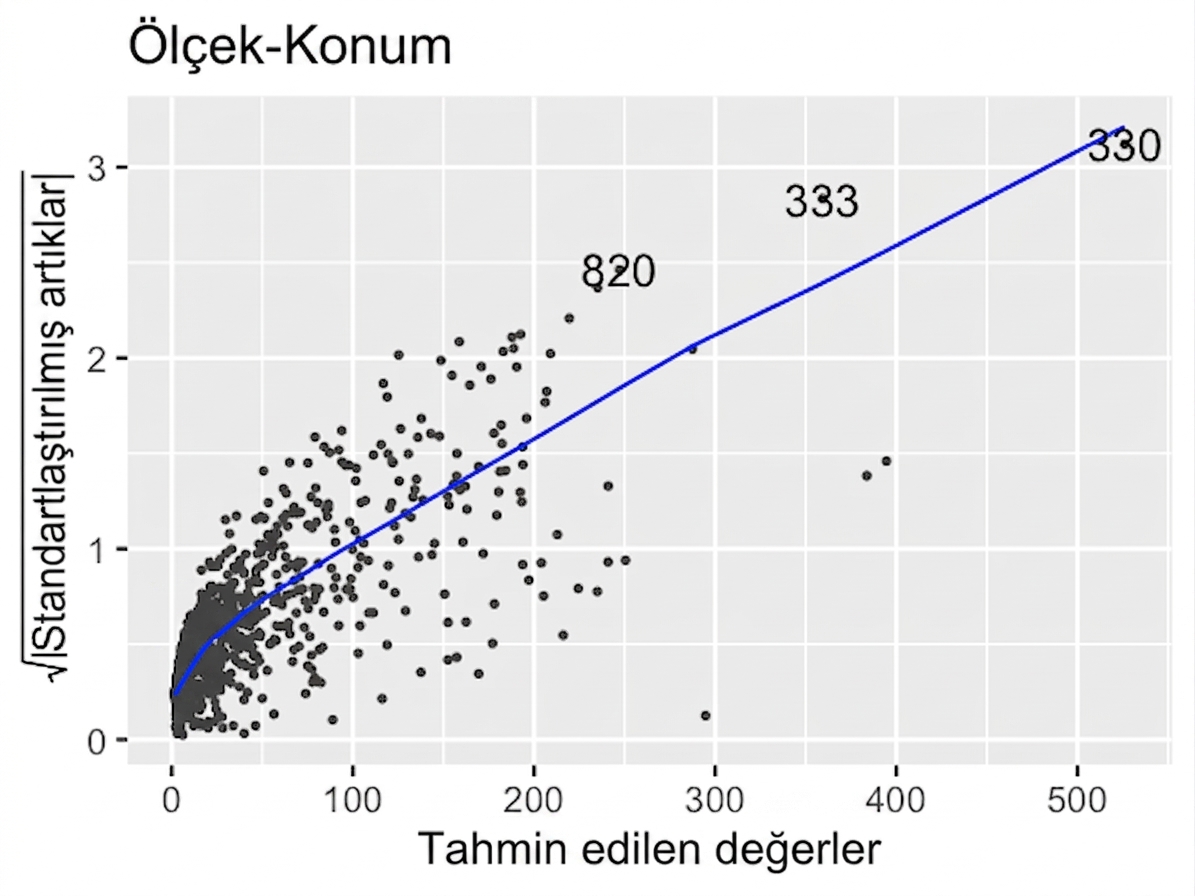
İşte önceki iki modelin normal ölçek-konumu grafikleri. Yani, artıkların büyüklüğünü uyumlanan değerlere karşı gösterirler.
Orijinal model (n_clicks ile n_impressions)
Dönüştürülmüş model (n_clicks ^ 0.25 ile n_impressions ^ 0.25)
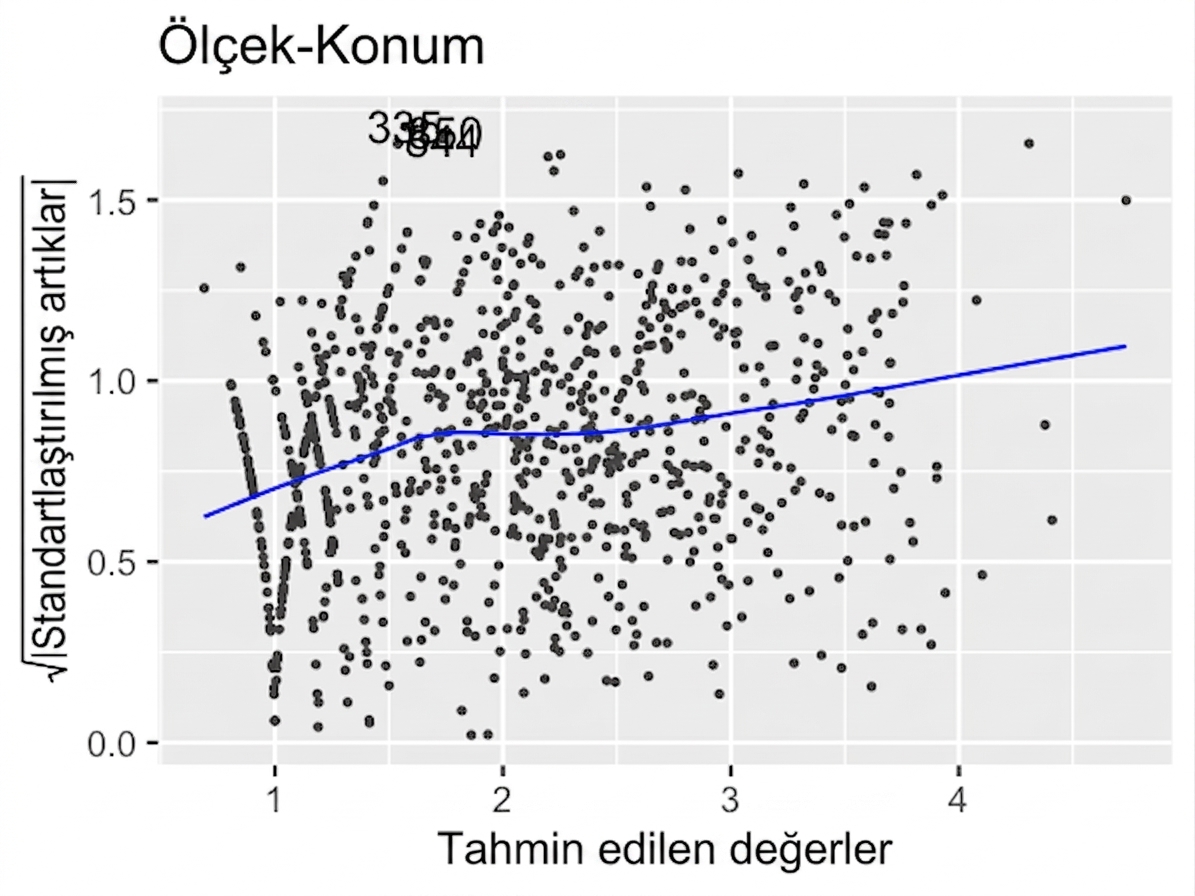
y-ekseni üzerindeki sayılara ve trend çizgisinin eğimine bak. Hangisi doğrudur?
Bu egzersiz, kursun bir parçasıdır
R'da Regresyona Giriş
Uygulamalı etkileşimli egzersiz
Teoriyi etkileşime dönüştürün, interaktif egzersizlerimizden biriyle
 Egzersize başla