Artıkların Q-Q grafiği
Önceki iki modelin normal Q-Q grafikleri aşağıdadır.
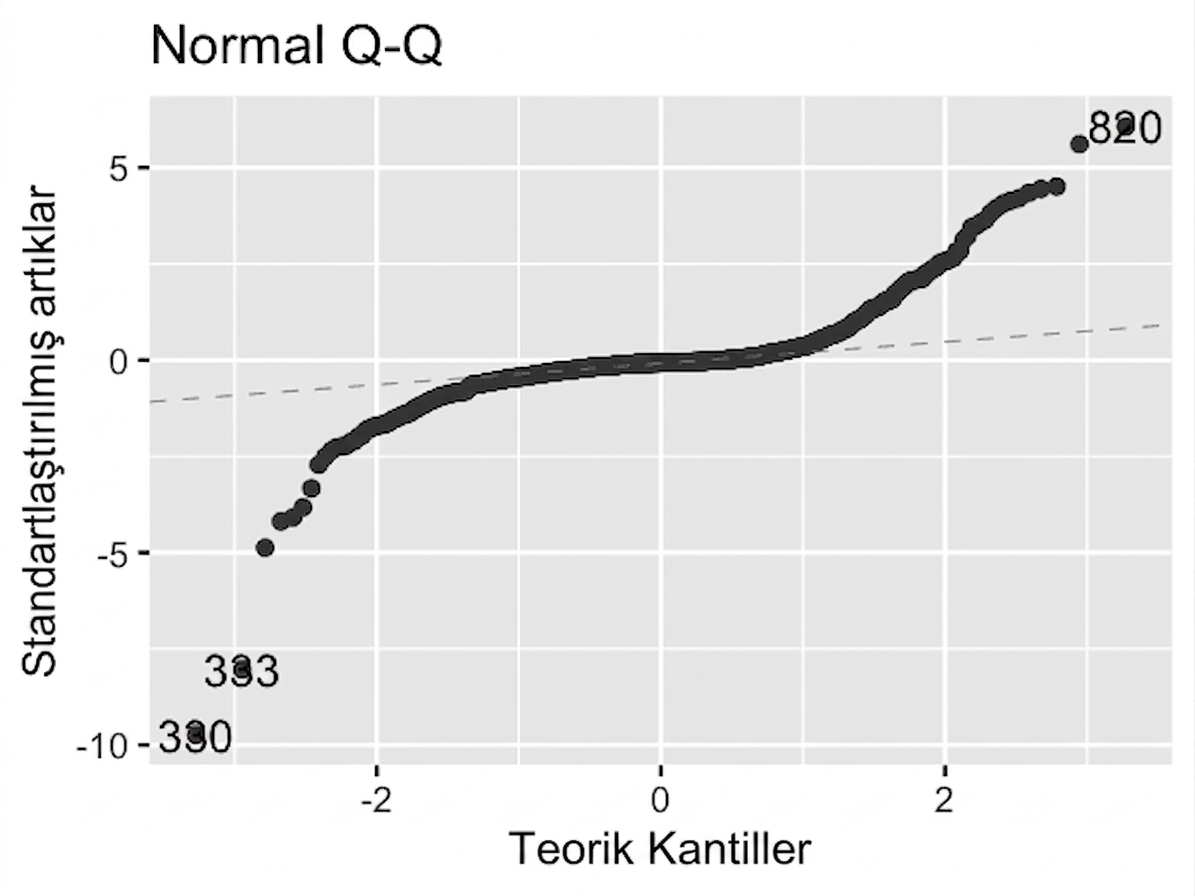
Orijinal model (n_clicks ve n_impressions)
Dönüştürülmüş model (n_clicks ^ 0.25 ve n_impressions ^ 0.25)
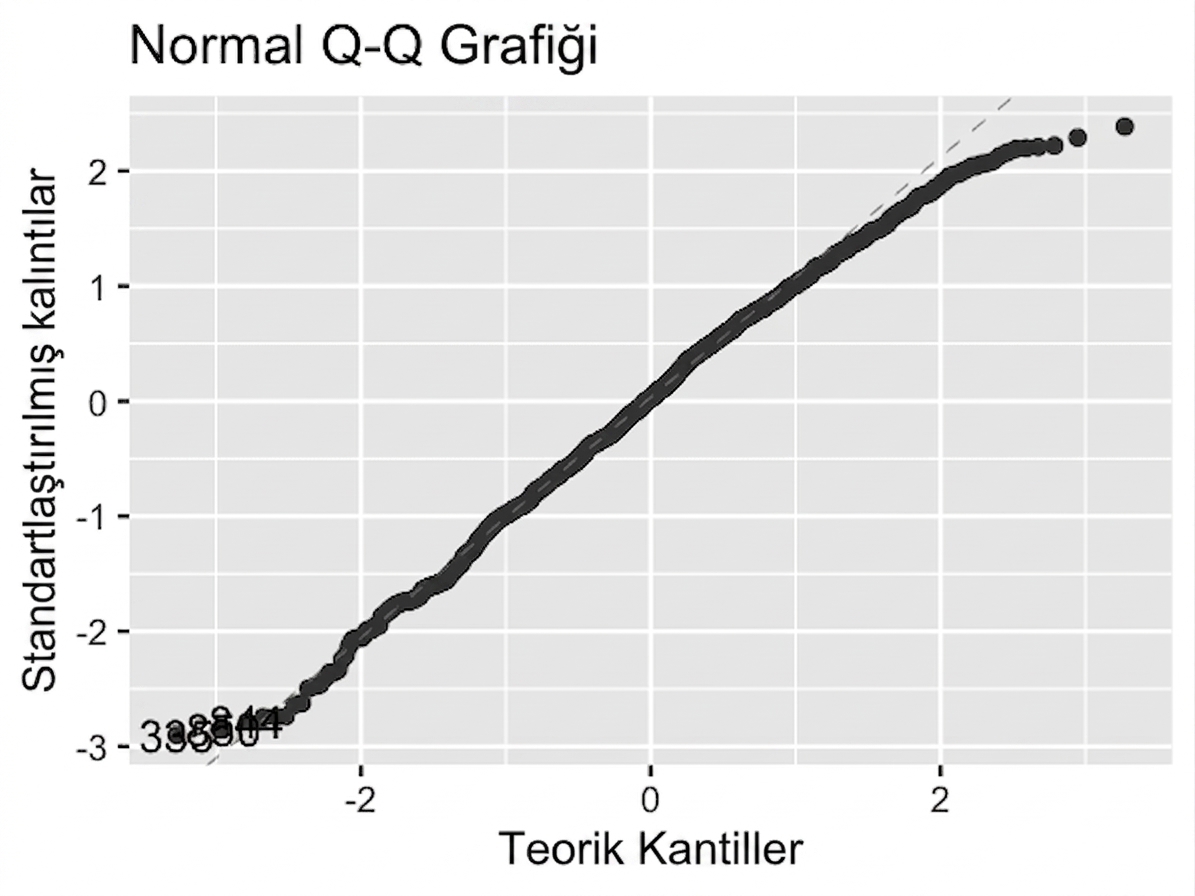
Noktaların "normallik" çizgisini ne kadar iyi takip ettiğine bak. Hangisi doğrudur?
Bu egzersiz, kursun bir parçasıdır
R'da Regresyona Giriş
Uygulamalı etkileşimli egzersiz
Teoriyi etkileşime dönüştürün, interaktif egzersizlerimizden biriyle
 Egzersize başla