Identificando deriva(s) relevante(s)
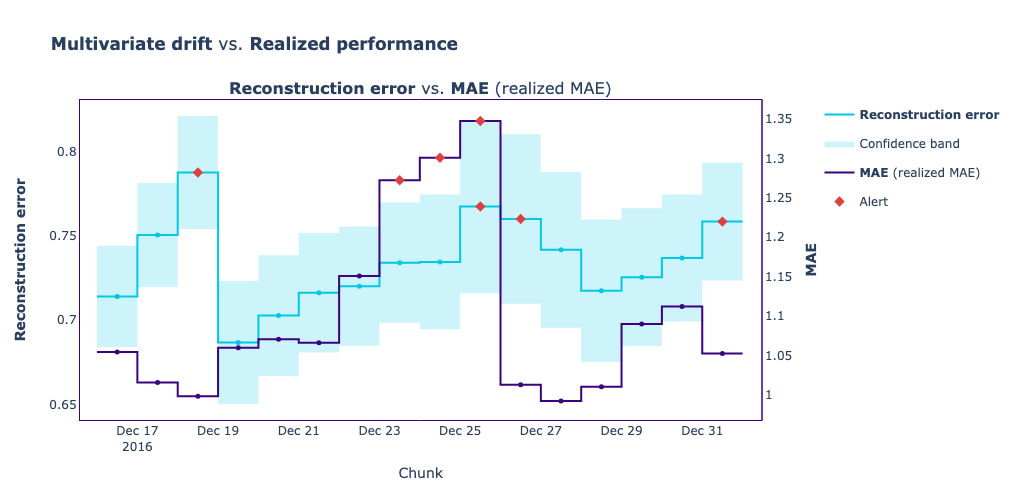
Lembre-se do exemplo do conjunto de dados do Green Taxi do Capítulo 2, em que o modelo previa o valor da gorjeta. Neste exercício, preparamos um gráfico comparativo que mostra os valores diários do erro de reconstrução obtido pelo método de detecção de deriva multivariada, em azul claro, juntamente com o desempenho realizado calculado usando a métrica MAE, em azul escuro.
Sua tarefa agora é identificar o dia em que uma deriva com alerta coincide com um alerta no desempenho do modelo.
Este exercicio faz parte do curso
Monitoramento de Machine Learning em Python
exercicio interativo prático
Transforme teoria em prática com um dos nossos exercicio interativos
 Iniciar exercicio