Identificação de valores discrepantes usando IQR
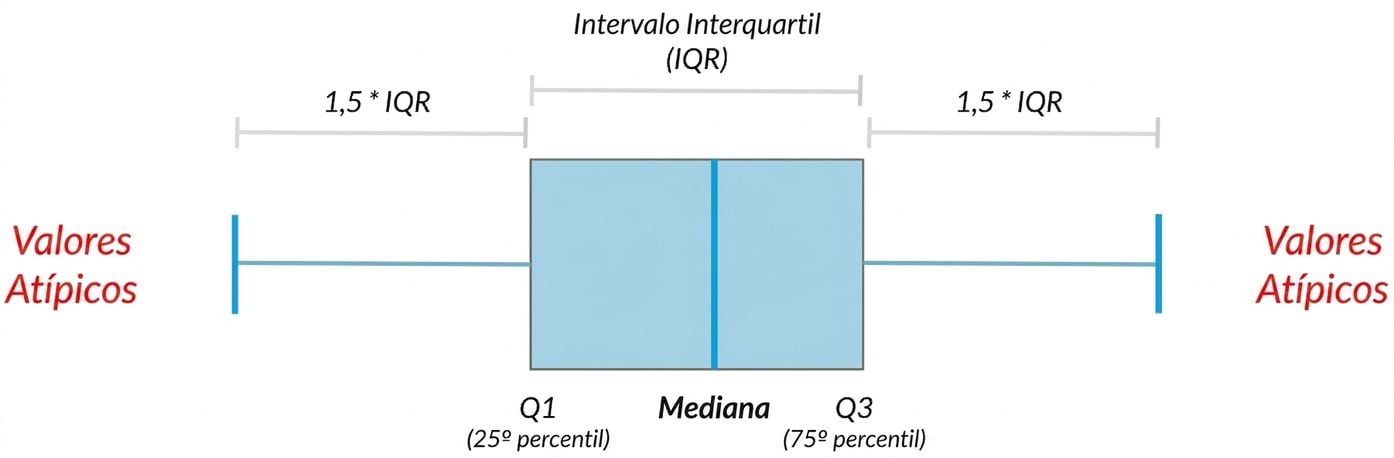
Os valores discrepantes podem ter grandes efeitos em estatísticas como a média, bem como em estatísticas que dependem da média, como a variância e o desvio padrão. O intervalo interquartil, ou IQR, é outra forma de medir a dispersão que é menos influenciada por valores discrepantes. O IQR também é usado com frequência para encontrar valores discrepantes. Se um valor for menor que \(\text{Q1} - 1.5 \times \text{IQR}\) ou maior que \(\text{Q3} + 1,5 \times \text{IQR}\), ele será considerado um valor atípico. Aliás, é assim que são calculados os comprimentos dos bigodes (whiskers) em um diagrama de caixa do matplotlib.
Neste exercício, você calculará o IQR e o usará para encontrar alguns valores discrepantes. pandas como pd e numpy como np estão carregados e food_consumption está disponível.
Este exercicio faz parte do curso
Introdução à estatística em Python
exercicio interativo prático
Tente este exercicio completando este código de exemplo.
# Calculate total co2_emission per country: emissions_by_country
emissions_by_country = ____

print(emissions_by_country)