BI's en betrouwbaarheidsniveau
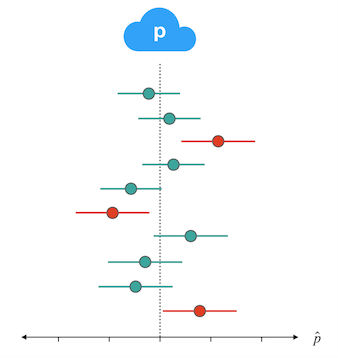
We hebben geleerd dat we bij een 95%-betrouwbaarheidsinterval (een betrouwbaarheidsniveau van 0,95), als we veel steekproeven van dezelfde grootte nemen en veel intervallen berekenen, verwachten dat 95% van de resulterende intervallen de parameter bevat. Op basis van de reeks betrouwbaarheidsintervallen die hier zijn uitgezet, wat is je beste gok voor het gebruikte betrouwbaarheidsniveau?
Zoals in de video wordt de populatieproportie weergegeven door de p in de wolk en de stippellijn, en elk betrouwbaarheidsinterval door een segment dat uitwaaiert vanaf de p-dakje. Intervallen die de echte waarde bevatten zijn groen; die het missen zijn rood.
Deze oefening maakt deel uit van de cursus
Inferentie voor categorische gegevens in R
Interactieve oefening met praktijkervaring
Zet theorie om in actie met een van onze interactieve oefeningen
 Begin oefening