Contingentietabellen begrijpen
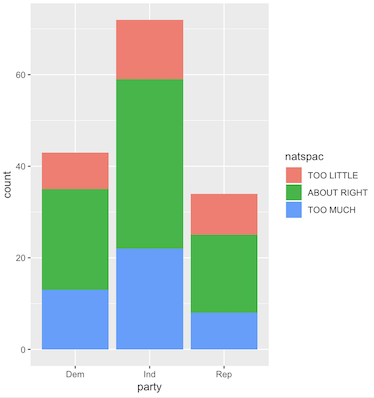
De staafgrafiek met aantallen die je hebt gemaakt is een visuele weergave van een contingentietabel.
Welke van de volgende uitspraken is ONJUIST over contingentietabellen?
Deze oefening maakt deel uit van de cursus
Inferentie voor categorische gegevens in R
Interactieve oefening met praktijkervaring
Zet theorie om in actie met een van onze interactieve oefeningen
 Begin oefening