Interpreting dendrogram
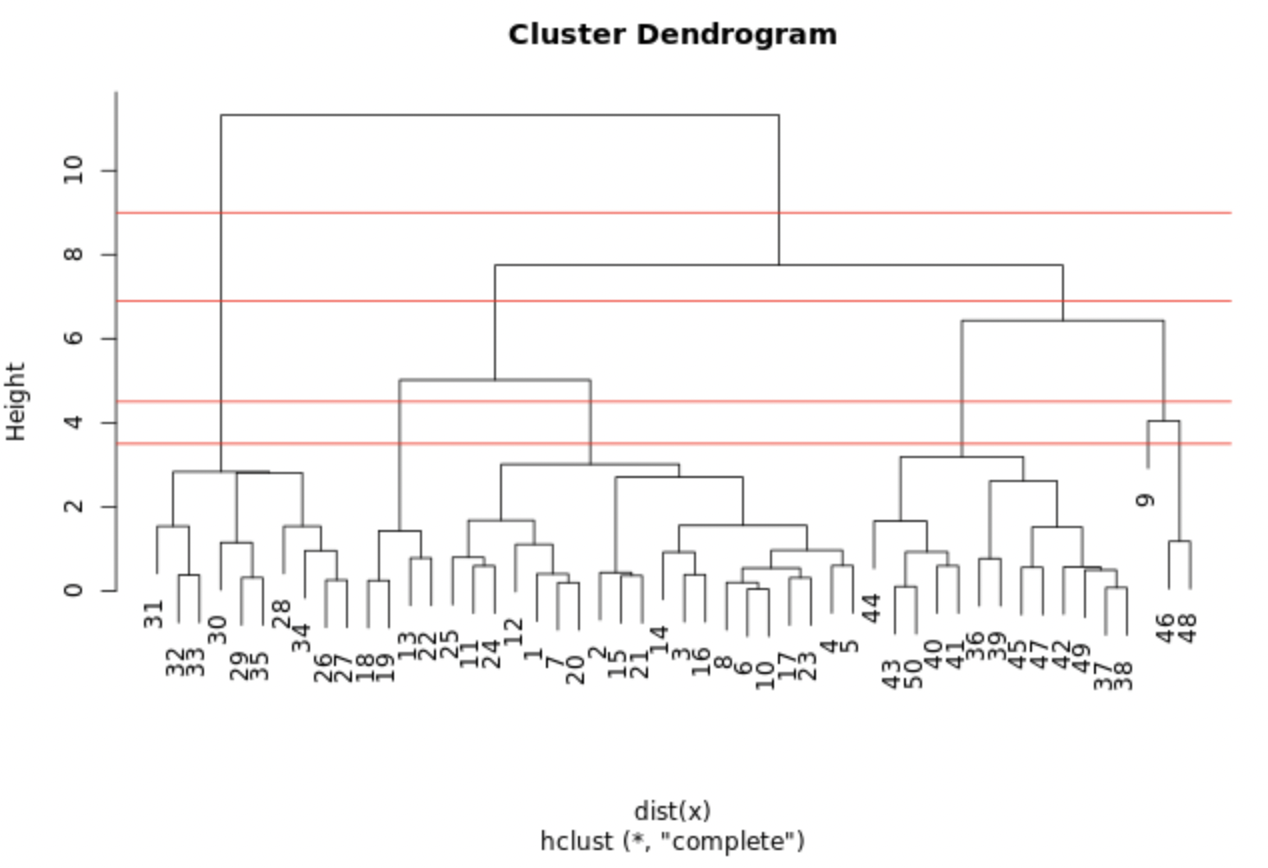
The plot displayed shows the hclust.out model you constructed in the previous exercise. We've drawn horizontal lines at heights of 3.5, 4.5, 6.9, and 9.0, respectively.
Which cut point yields 3 clusters?
この演習はコースの一部です
The plot displayed shows the hclust.out model you constructed in the previous exercise. We've drawn horizontal lines at heights of 3.5, 4.5, 6.9, and 9.0, respectively.
Which cut point yields 3 clusters?
この演習はコースの一部です
