Interpretare un dendrogramma
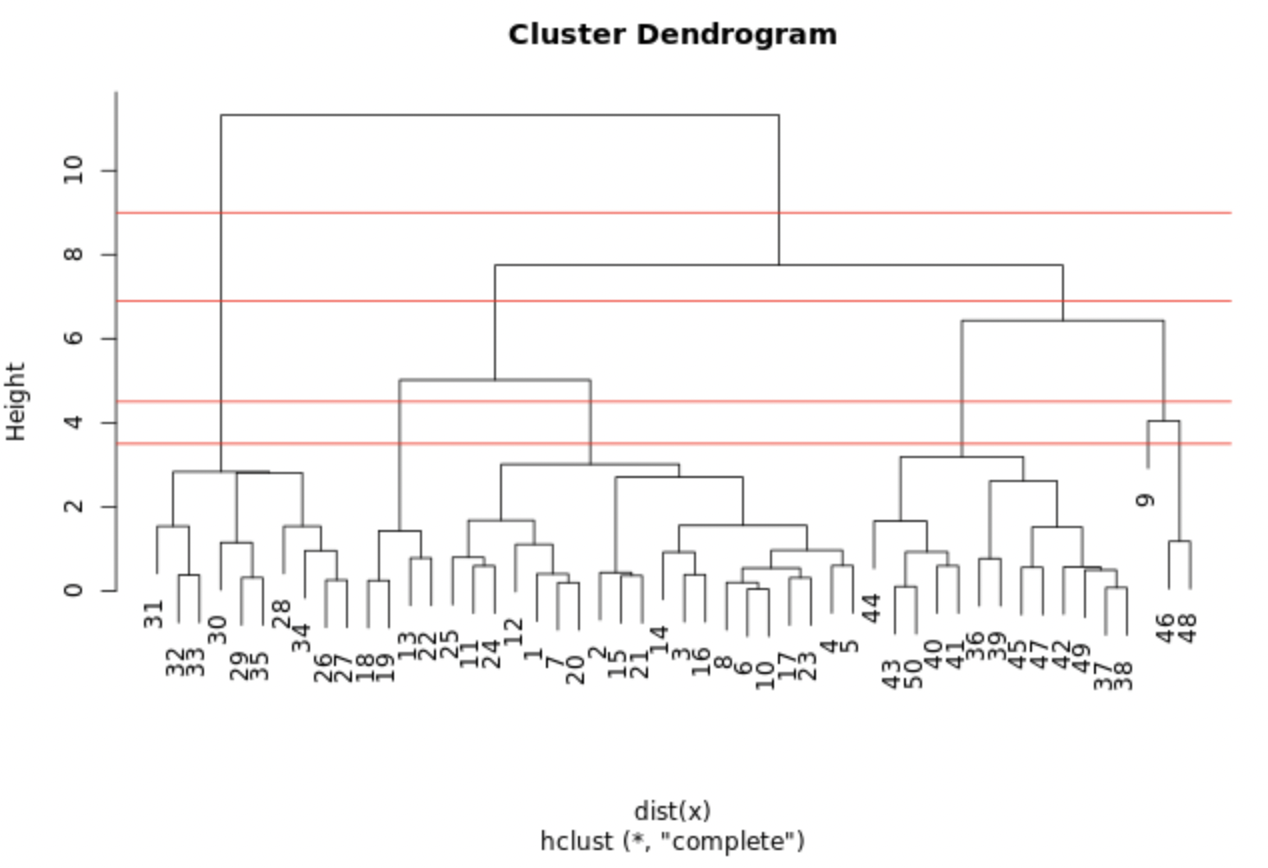
Il grafico mostrato rappresenta il modello hclust.out che hai costruito nell’esercizio precedente. Abbiamo tracciato linee orizzontali alle altezze di 3.5, 4.5, 6.9 e 9.0.
Quale punto di taglio produce 3 cluster?
Questo esercizio fa parte del corso
Unsupervised Learning in R
esercizio interattivo pratico
Trasforma la teoria in pratica con uno dei nostri esercizi interattivi
 Inizia esercizio