Scale-location
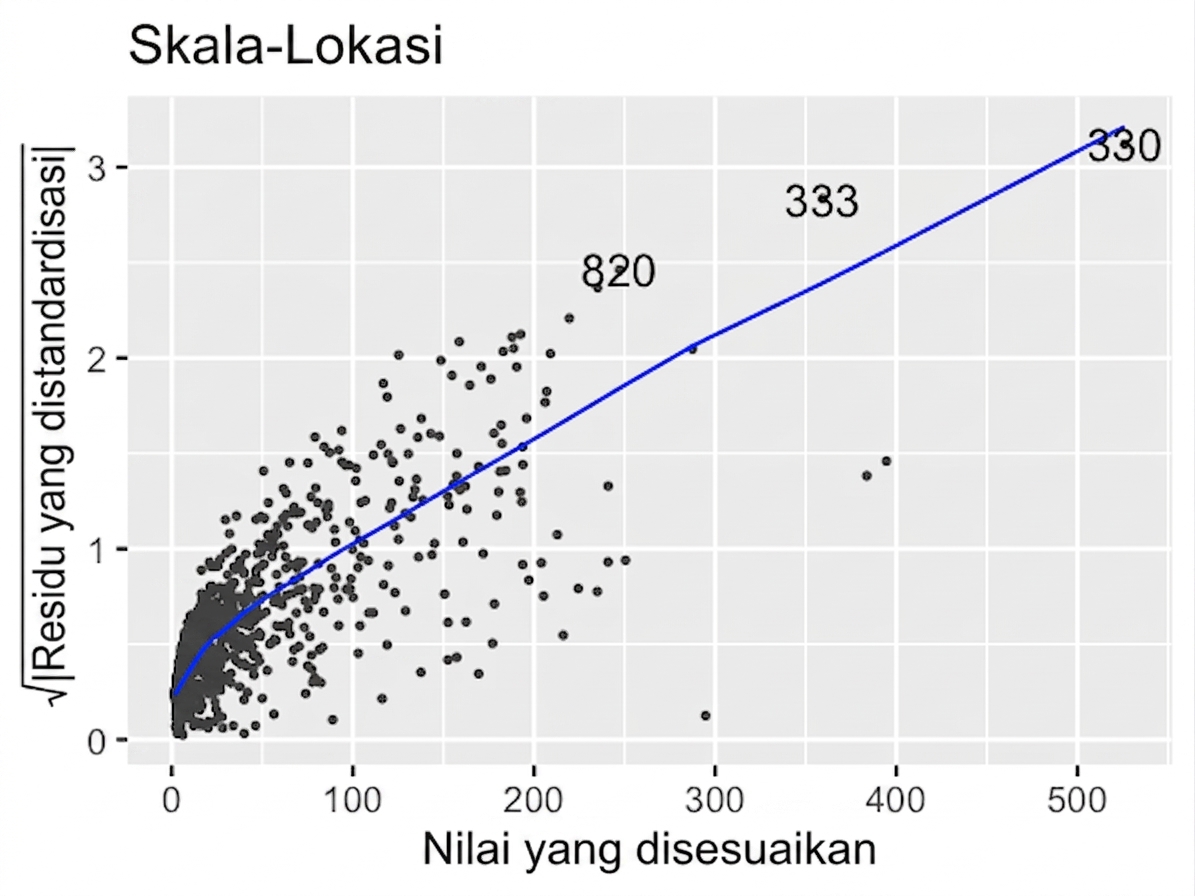
Berikut adalah plot scale-location normal untuk dua model sebelumnya. Plot ini menunjukkan besar residual terhadap nilai terduga (fitted values).
Model asli (n_clicks versus n_impressions)
Model yang ditransformasi (n_clicks ^ 0.25 versus n_impressions ^ 0.25)
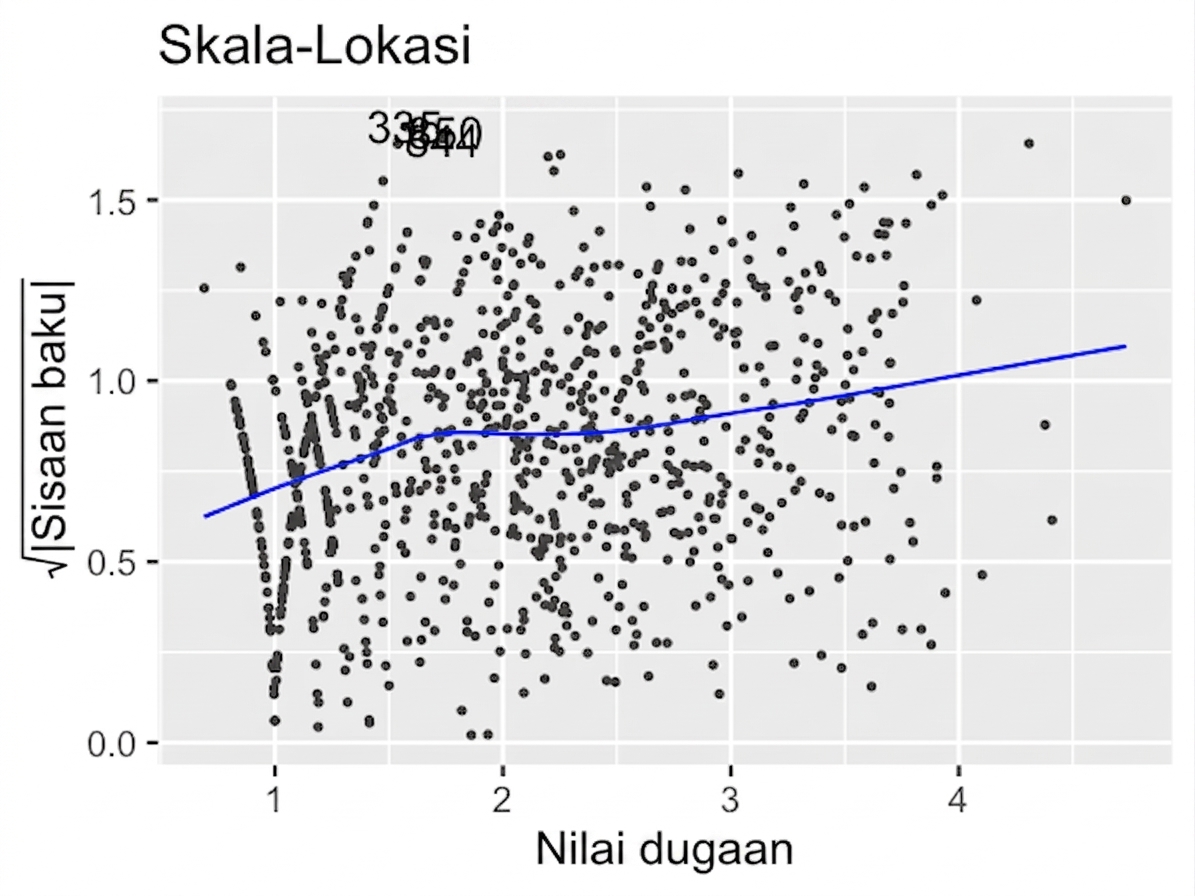
Perhatikan angka pada sumbu-y dan kemiringan garis tren. Pernyataan mana yang benar?
Latihan ini merupakan bagian dari kursus
Pengantar Regresi di R
Latihan interaktif langsung
Ubah teori menjadi aksi dengan salah satu latihan interaktif kami
 Mulai latihan