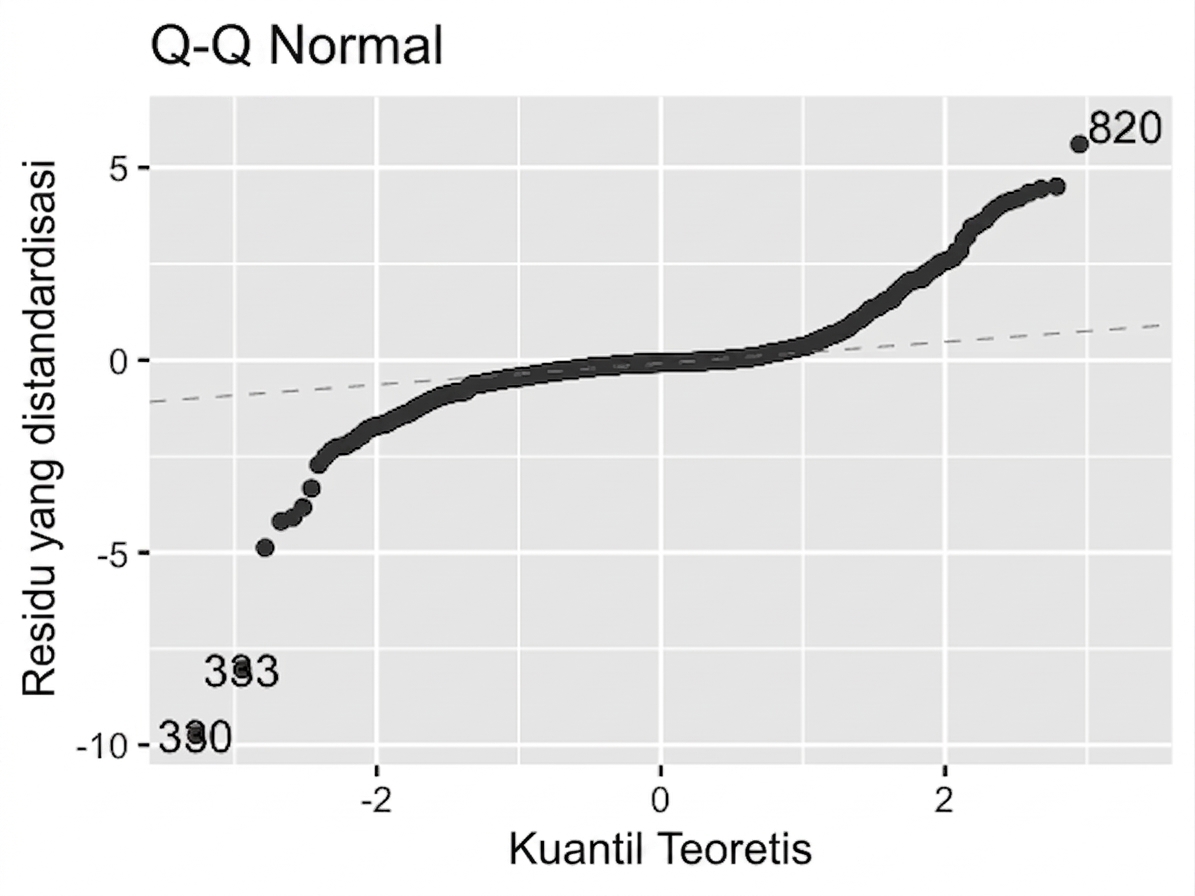
Plot Q-Q dari residual
Berikut adalah plot Q-Q normal dari dua model sebelumnya.
Model asli (n_clicks terhadap n_impressions)
Model yang ditransformasikan (n_clicks ^ 0.25 terhadap n_impressions ^ 0.25)
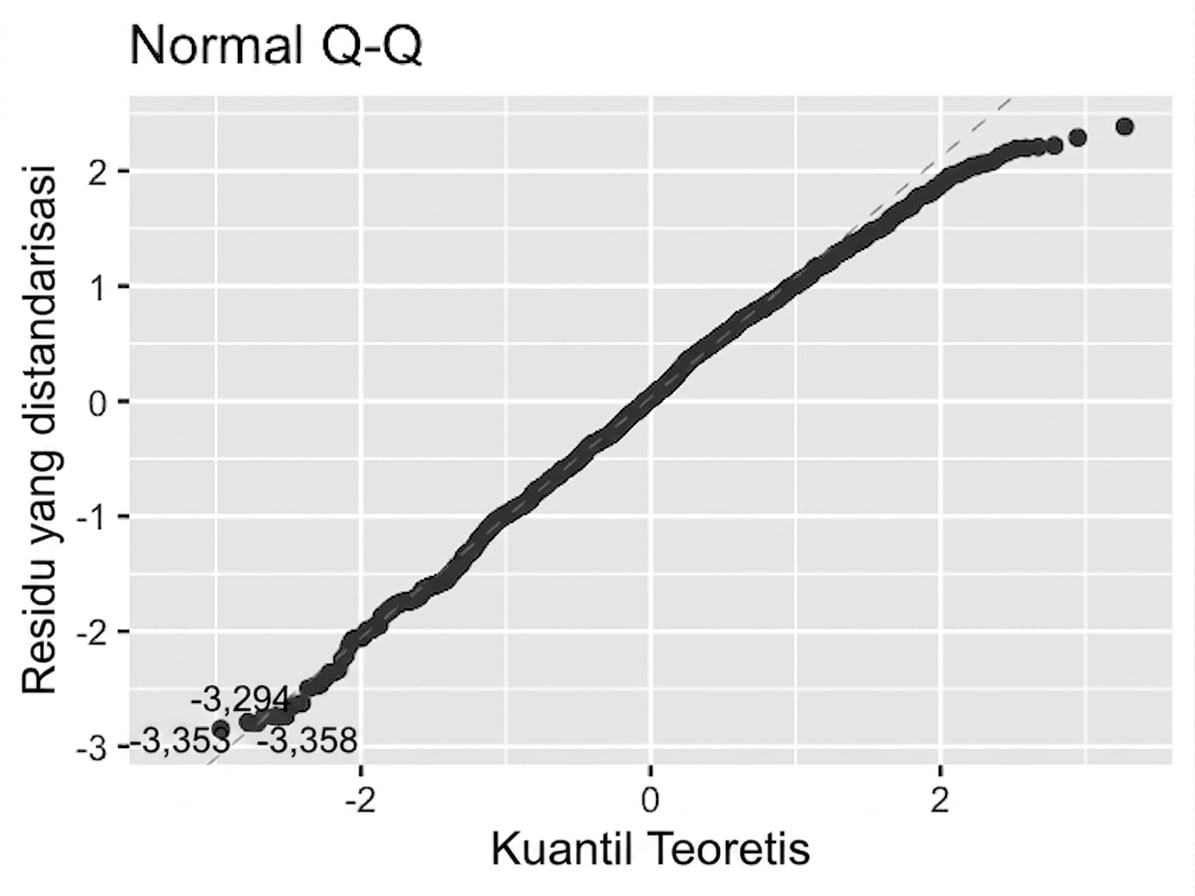
Perhatikan seberapa baik titik-titik mengikuti garis "normalitas". Pernyataan mana yang benar?
Latihan ini merupakan bagian dari kursus
Pengantar Regresi di R
Latihan interaktif langsung
Ubah teori menjadi aksi dengan salah satu latihan interaktif kami
 Mulai latihan