Understanding KPI chart trends
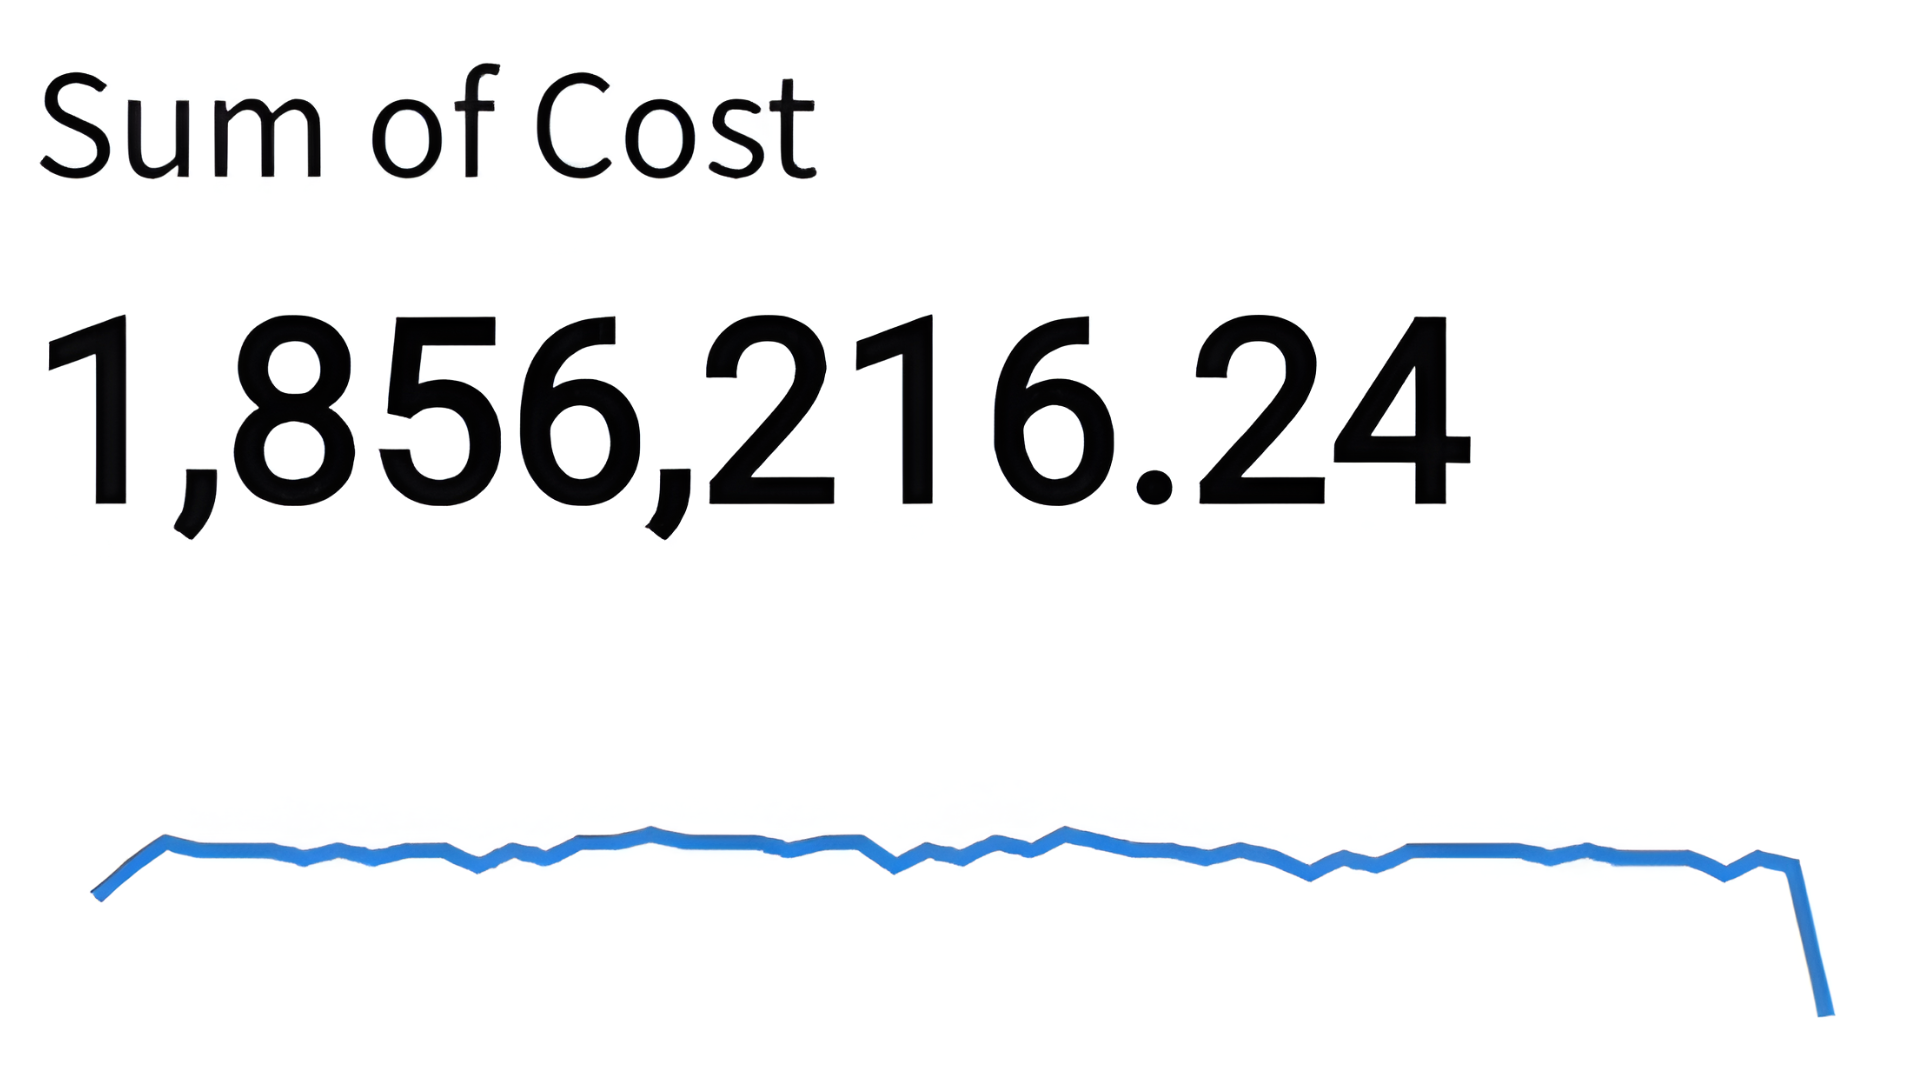
The line under this KPI chart is called the (A). It requires a field to be dropped on the chart’s timeline menu, and (B) for all KPI charts.
Cet exercice fait partie du cours
<cours>Visualizations in Sigma</cours>Exercice interactif pratique
Transformez la théorie en action avec l’un de nos exercices interactifs
 Commencer l’exercice