Construire un graphe pondéré
Dans la dernière vidéo, vous avez appris à mettre en œuvre un graphe en Python.
class Graph:

  def __init__(self):

    self.vertices = {}


  def add_vertex(self, vertex):

    self.vertices[vertex] = []


  def add_edge(self, source, target):

    self.vertices[source].append(target)
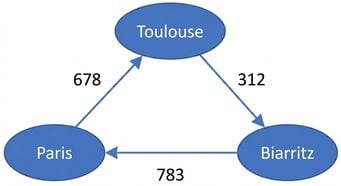
Cet exercice se déroule en deux étapes. Dans la première, vous modifierez ce code afin qu'il puisse être utilisé pour créer un graphique pondéré. Pour ce faire, vous pouvez utiliser un tableau de hachage pour représenter les sommets adjacents avec leurs poids. Dans la deuxième étape, vous construirez le graphique pondéré suivant :
Cet exercice fait partie du cours
<cours>Structures de données et algorithmes en Python</cours>Exercice interactif pratique
Essayez cet exercice en complétant ce code d’exemple.
class WeightedGraph:
  def __init__(self):
    self.vertices = {}

  def add_vertex(self, vertex):
    # Set the data for the vertex
    self.vertices[____] = []

  def add_edge(self, source, target, weight):
    # Set the weight
    self.vertices[____].append([____, ____])