Préparer les données pour un graphique en grille de facettes
Dans cet exercice, vous allez préparer les données pour réaliser ce graphique :
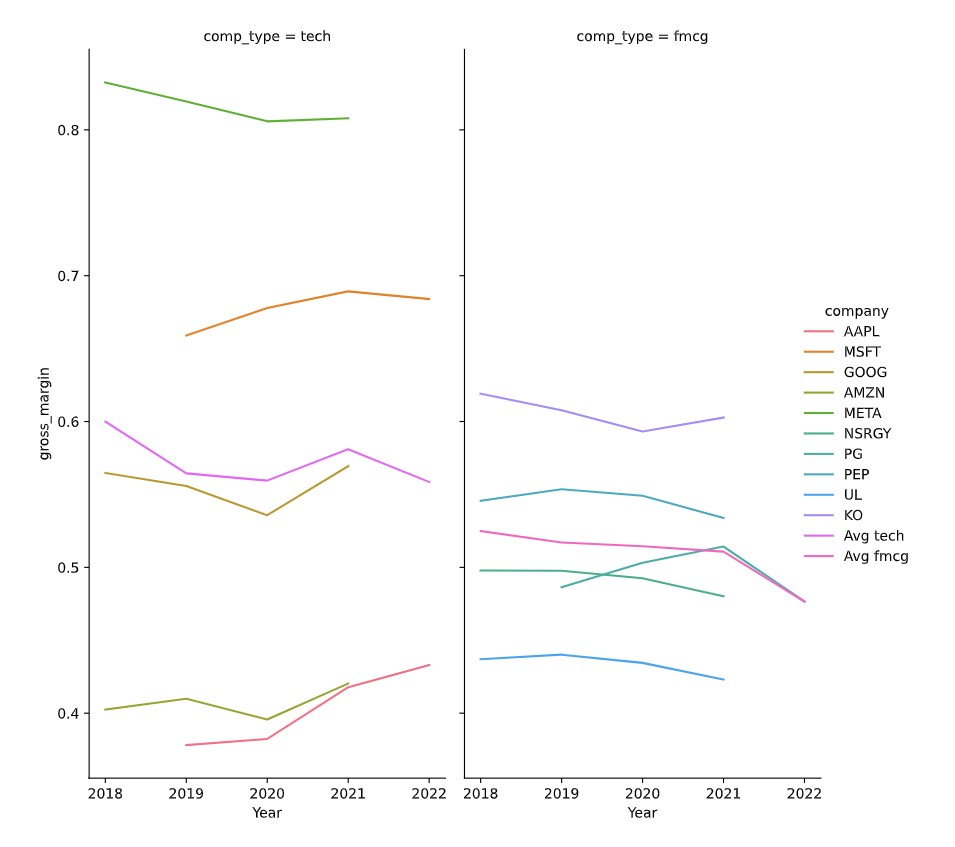 Dans le prochain exercice, vous vous entraînerez à tracer le graphique. Ce graphique est pratique pour observer :
- La marge brute des entreprises tech est plus dispersée que celle des entreprises FMCG
- Année après année, à quel point une entreprise est rentable par rapport à la moyenne de son secteur.
pandas est importé sous l’alias pd et seaborn sous l’alias sns. Un DataFrame pandas nommé dataset est chargé pour vous et contient déjà une colonne gross_margin calculée.
Cet exercice fait partie du cours
<cours>Analyser les états financiers en Python</cours>Exercice interactif pratique
Essayez cet exercice en complétant ce code d’exemple.
# Subset tech and fmcg companies
subset_dat = dataset.loc[____]