Understanding KPI chart trends
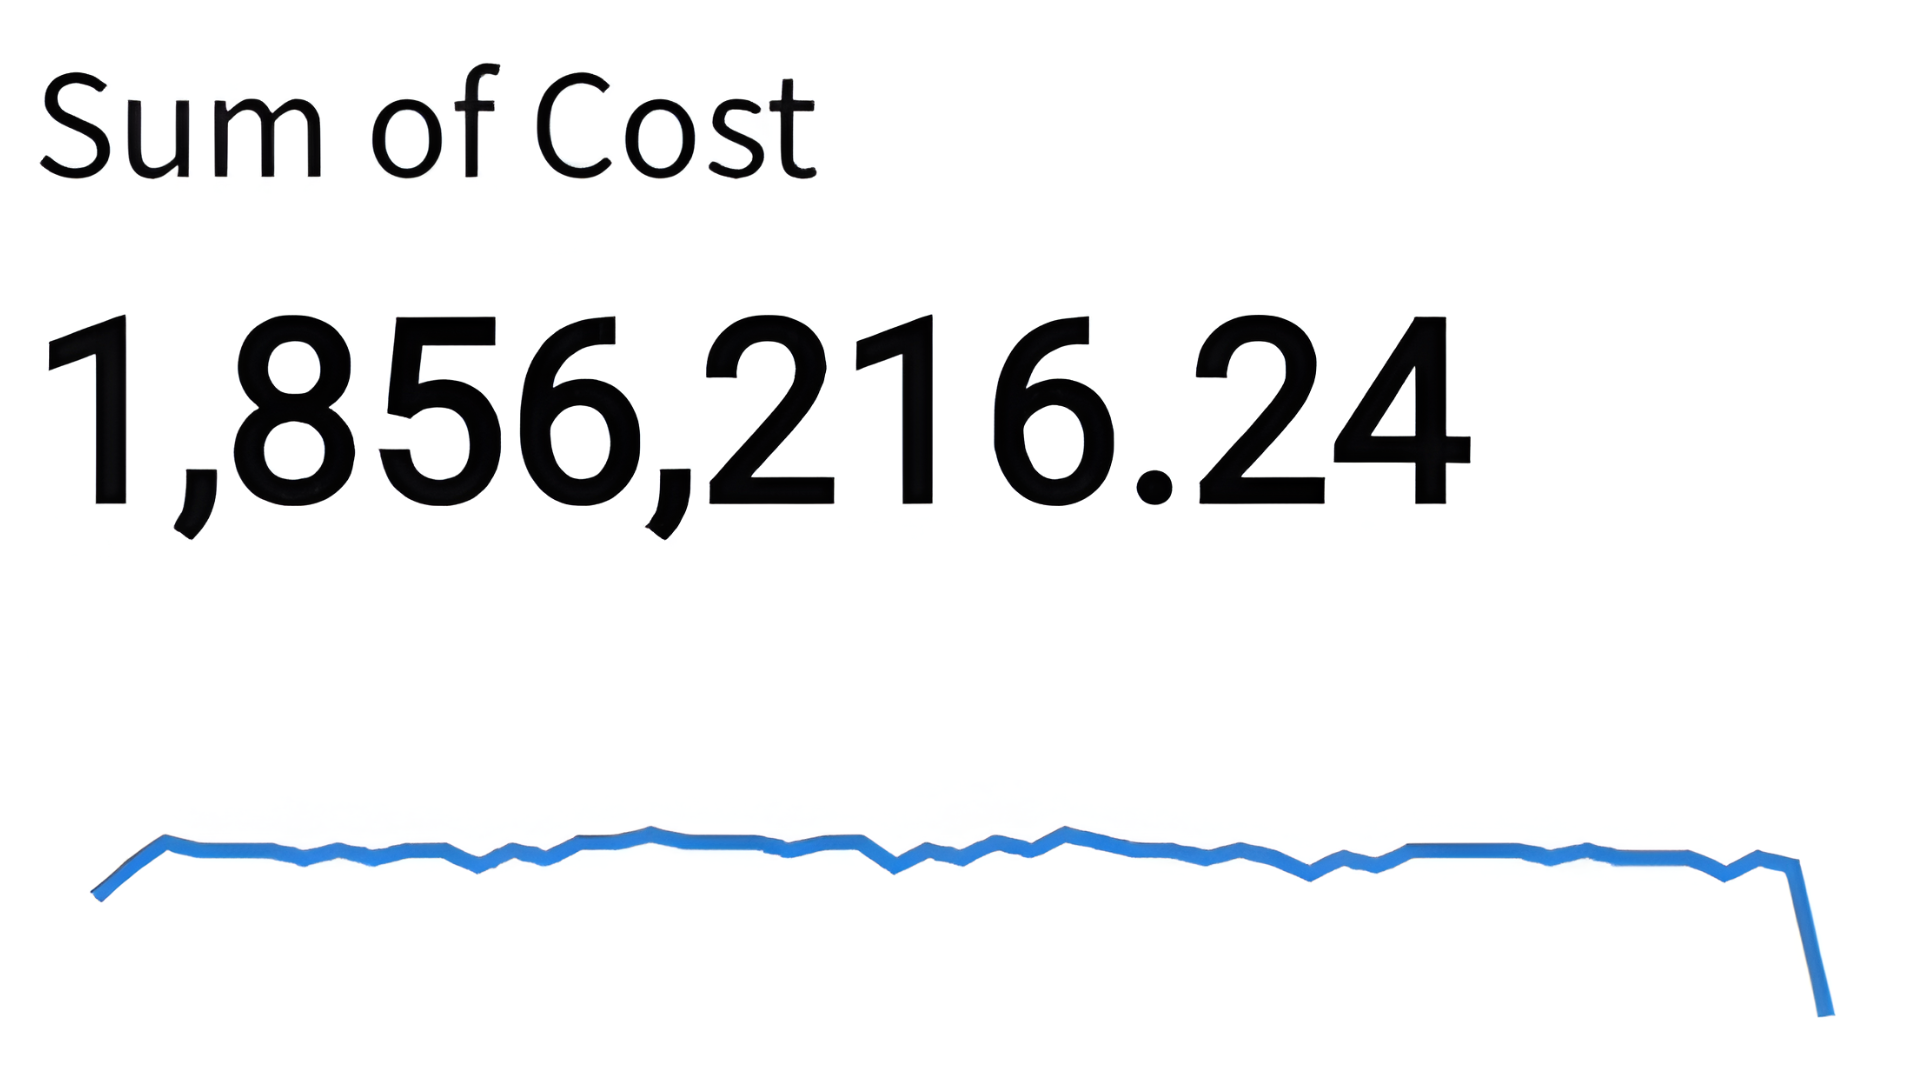
The line under this KPI chart is called the (A). It requires a field to be dropped on the chart’s timeline menu, and (B) for all KPI charts.
Este ejercicio forma parte del curso
Visualizations in Sigma
ejercicio interactivo práctico
Convierte la teoría en práctica con uno de nuestros ejercicios interactivos
 Empezar ejercicio