Preparar los datos para un gráfico con facet grid
En este ejercicio, vas a preparar los datos para crear este gráfico:
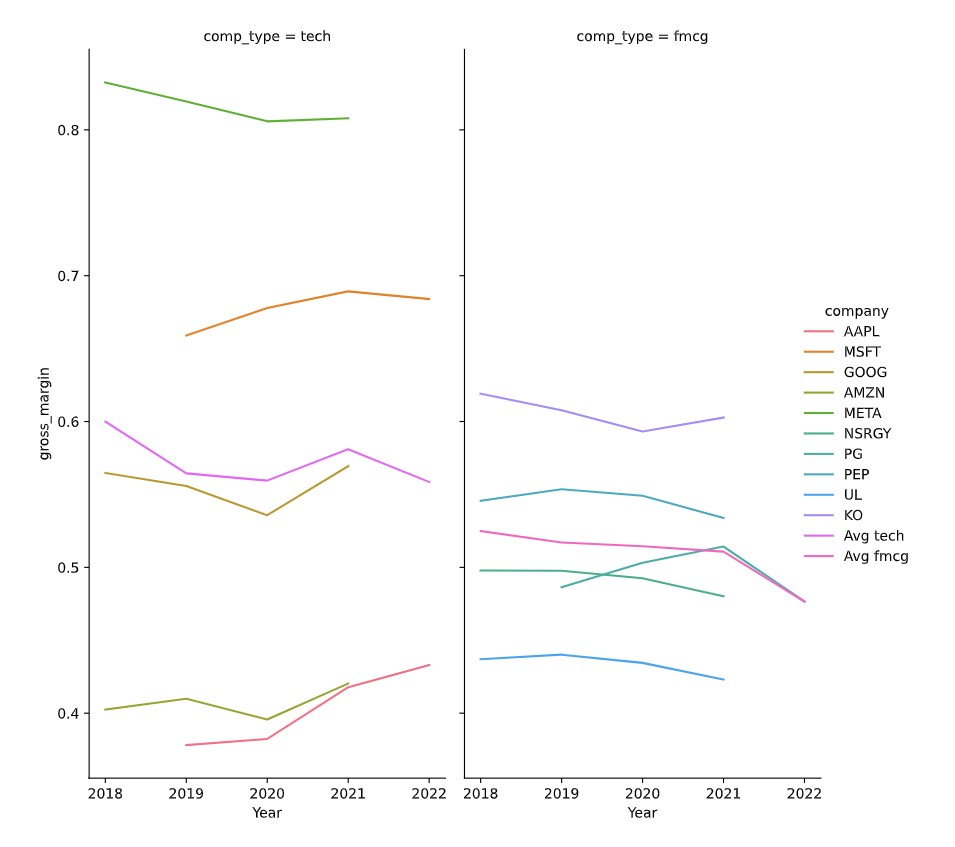 En el siguiente ejercicio, practicarás cómo construir el gráfico. Este gráfico es útil para observar:
- El margen bruto de las empresas tecnológicas está más disperso que el de las empresas de gran consumo (FMCG).
- Año a año, cuán rentable es una empresa en comparación con la media de su sector.
pandas está cargado con el alias pd y seaborn con el alias sns. Tienes cargado un DataFrame de pandas llamado dataset que ya incluye una columna gross_margin calculada.
Este ejercicio forma parte del curso
Análisis de estados financieros en Python
ejercicio interactivo práctico
Prueba este ejercicio completando este código de ejemplo.
# Subset tech and fmcg companies
subset_dat = dataset.loc[____]