Understanding KPI chart trends
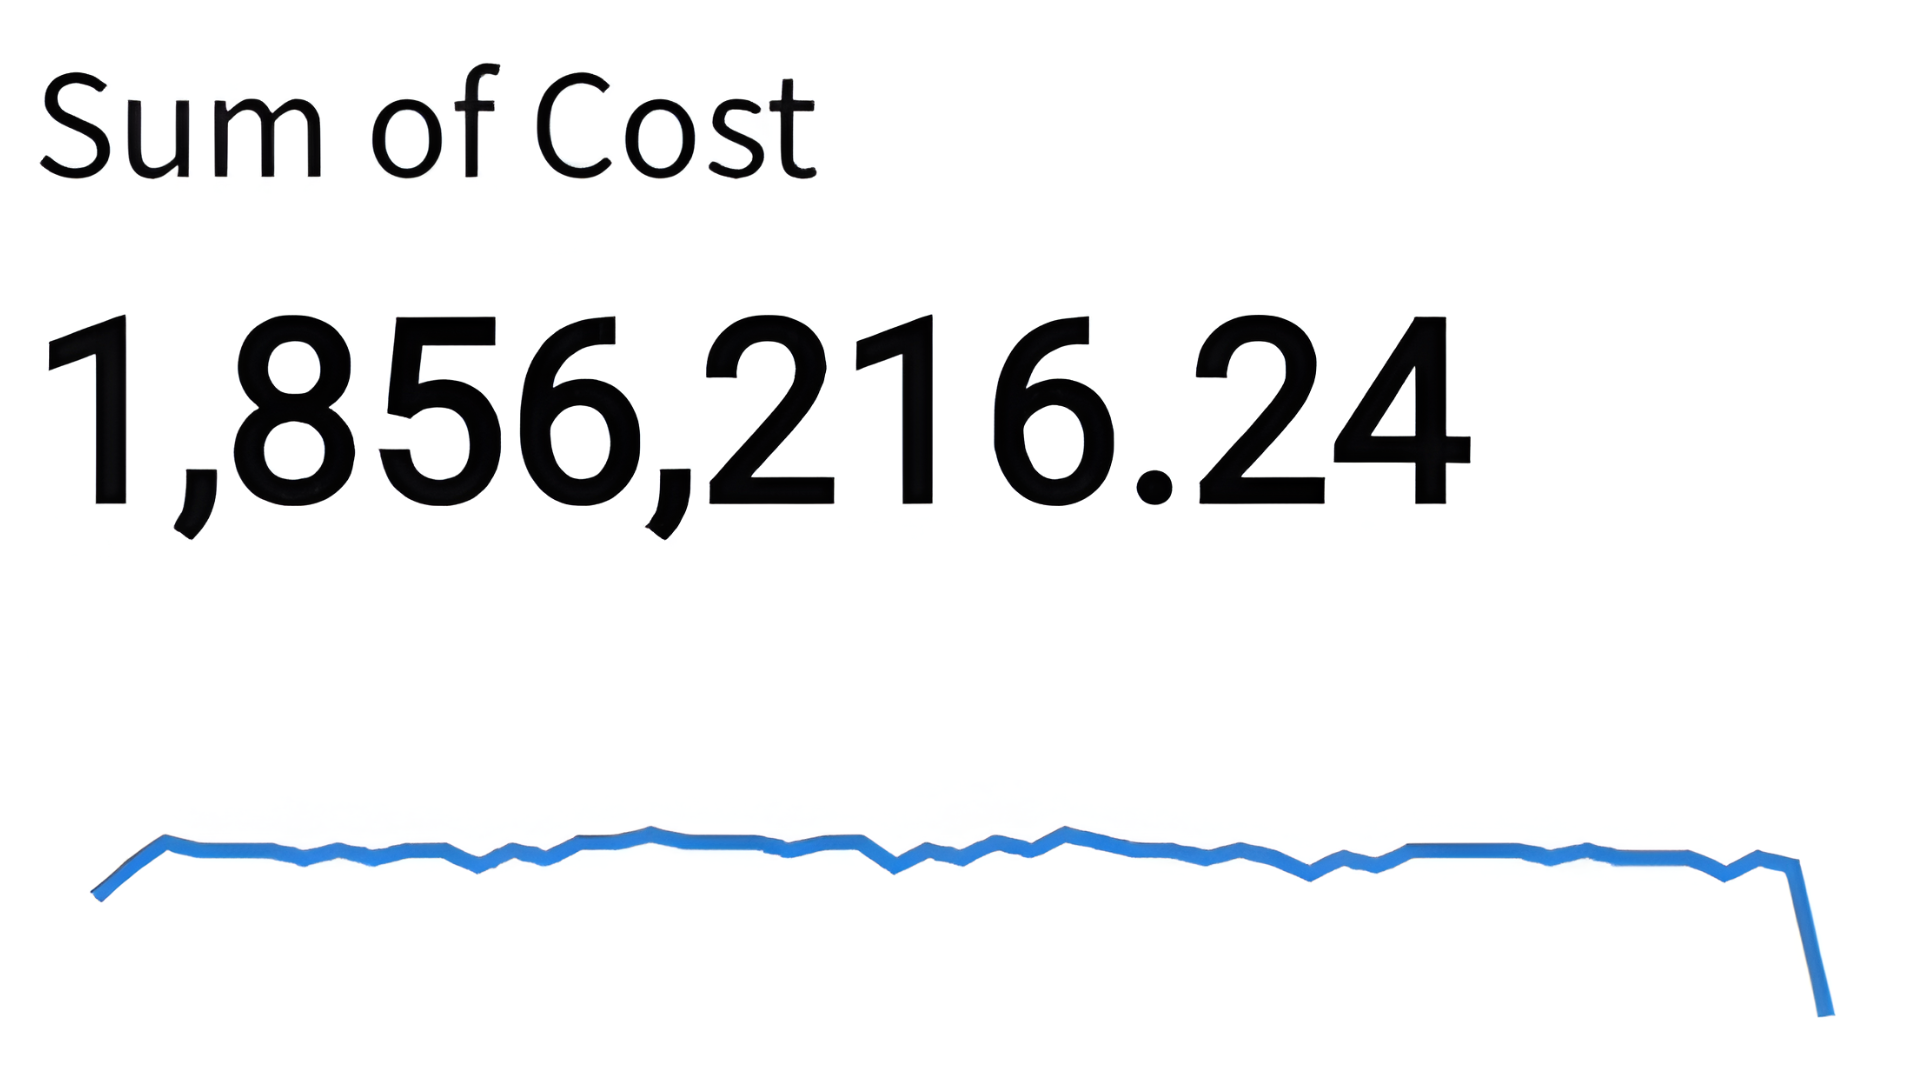
The line under this KPI chart is called the (A). It requires a field to be dropped on the chart’s timeline menu, and (B) for all KPI charts.
Diese Übung ist Teil des Kurses
<Kurs>Visualizations in Sigma</Kurs>Interaktive praktische Übung
Verwandle Theorie mit einer unserer interaktiven Übungen in die Praxis
 Übung starten