Manufacturing Optimization: Score & Rank
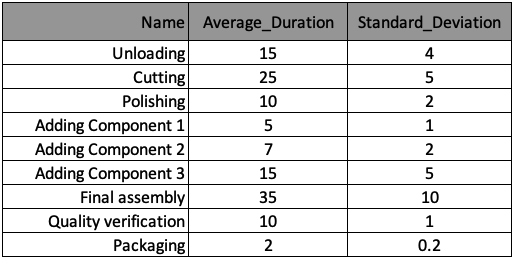
Let's use the same discrete-event model of the wall clock factory and set up a "Score & Rank" optimization routine. For your convenience, the manufacturing process is summarized again in the table below. The information has been stored in a list of dictionaries named processes, with one dictionary per process. The keys of this dictionary correspond to the table column headers.
The plot_results() method used to generate the plots in this exercise has been pre-loaded and is shown below.
def plot_results(objective_func):
    # Score
    fig, axes = plt.subplots(1, len(processes), sharey=True, figsize=(10, 8))
    for p in range(len(processes)):
        sns.scatterplot(ax=axes[p], x=process_duration_all[:, p], y=objective_func, c=objective_func, cmap="turbo_r")
        axes[p].set_title(processes[p]["Name"], rotation = 20, horizontalalignment='left')
        axes[p].set_xlabel("Duration [min]", rotation = -10)
        axes[p].grid()
    axes[0].set_ylabel("Objective function score")
    plt.show()

    # Rank
    index_sort = np.argsort(objective_func)
    fig, axes = plt.subplots(1, len(processes), sharey=True, figsize=(10, 8))
    for p in range(len(processes)):
        sns.lineplot(ax=axes[p], x=np.linspace(0, NUM_SIMULATIONS, NUM_SIMULATIONS),
                     y=process_duration_all[index_sort, p], color="orchid")
        axes[p].set_title(processes[p]["Name"], rotation = 20, horizontalalignment='left')
        axes[p].set_xlabel("Score-ranked scenarios", rotation = -10)
        axes[p].grid()
    axes[0].set_ylabel("Duration [min]")
    plt.show()
The Monte-Carlo sampling loop will produce a series of possible process trajectories and score them, as shown in the figure.
This exercise is part of the course
Discrete Event Simulation in Python
Exercise instructions
- Add the score-contribution of each process, knowing that the duration of processes is stored in
process_duration_all[s, p]and their respective weight inproc_p["score_weight_0_10"]. - Set the for loop to run
NUM_SIMULATIONSMonte-Carlo runs withsas the dummy variable. - Run the Monte Carlo engine stored in the function
run_monte_carlo()(this will generate both the "score" and "rank" plots)
Hands-on interactive exercise
Have a go at this exercise by completing this sample code.
def objective_function_calc():
    objective_func = np.ones(NUM_SIMULATIONS)

    for s in range(NUM_SIMULATIONS):
        for p in range(len(processes)):
            proc_p = processes[p]

            # Add the score contribution of each process
            objective_func[s] += ____

    plot_results(objective_func)

def run_monte_carlo():

    # Set the for-loop to run NUM_SIMULATIONS Monte-Carlo runs
    ____

        env = simpy.Environment()
        env.process(manufractoring_process(env, s))
        env.run()

    objective_function_calc()

# Run the Monte Carlo function
____