Monte Carlo sampling for a discrete-event model with SimPy
Now let's build the same Monte-Carlo sampling analysis using a SimPy version of the model. The SimPy model has a generator named manufacturing_process, which simulates different processes, and a function called run_monte_carlo that runs the model multiple times, storing the information in a NumPy array named time_record.
The code that plots the results is similar to the one used in the previous exercise, but it has been moved to a function named plot_results() that is shown below.
def plot_results():

    df_disc = pd.DataFrame({cNam[0]: process_line_space, cNam[1]: time_record})
    fig = sns.lineplot(data=df_disc, x=cNam[0], y=cNam[1], marker="o")
    fig.set(xlim=(0, len(processes) + 1))
    plt.plot()
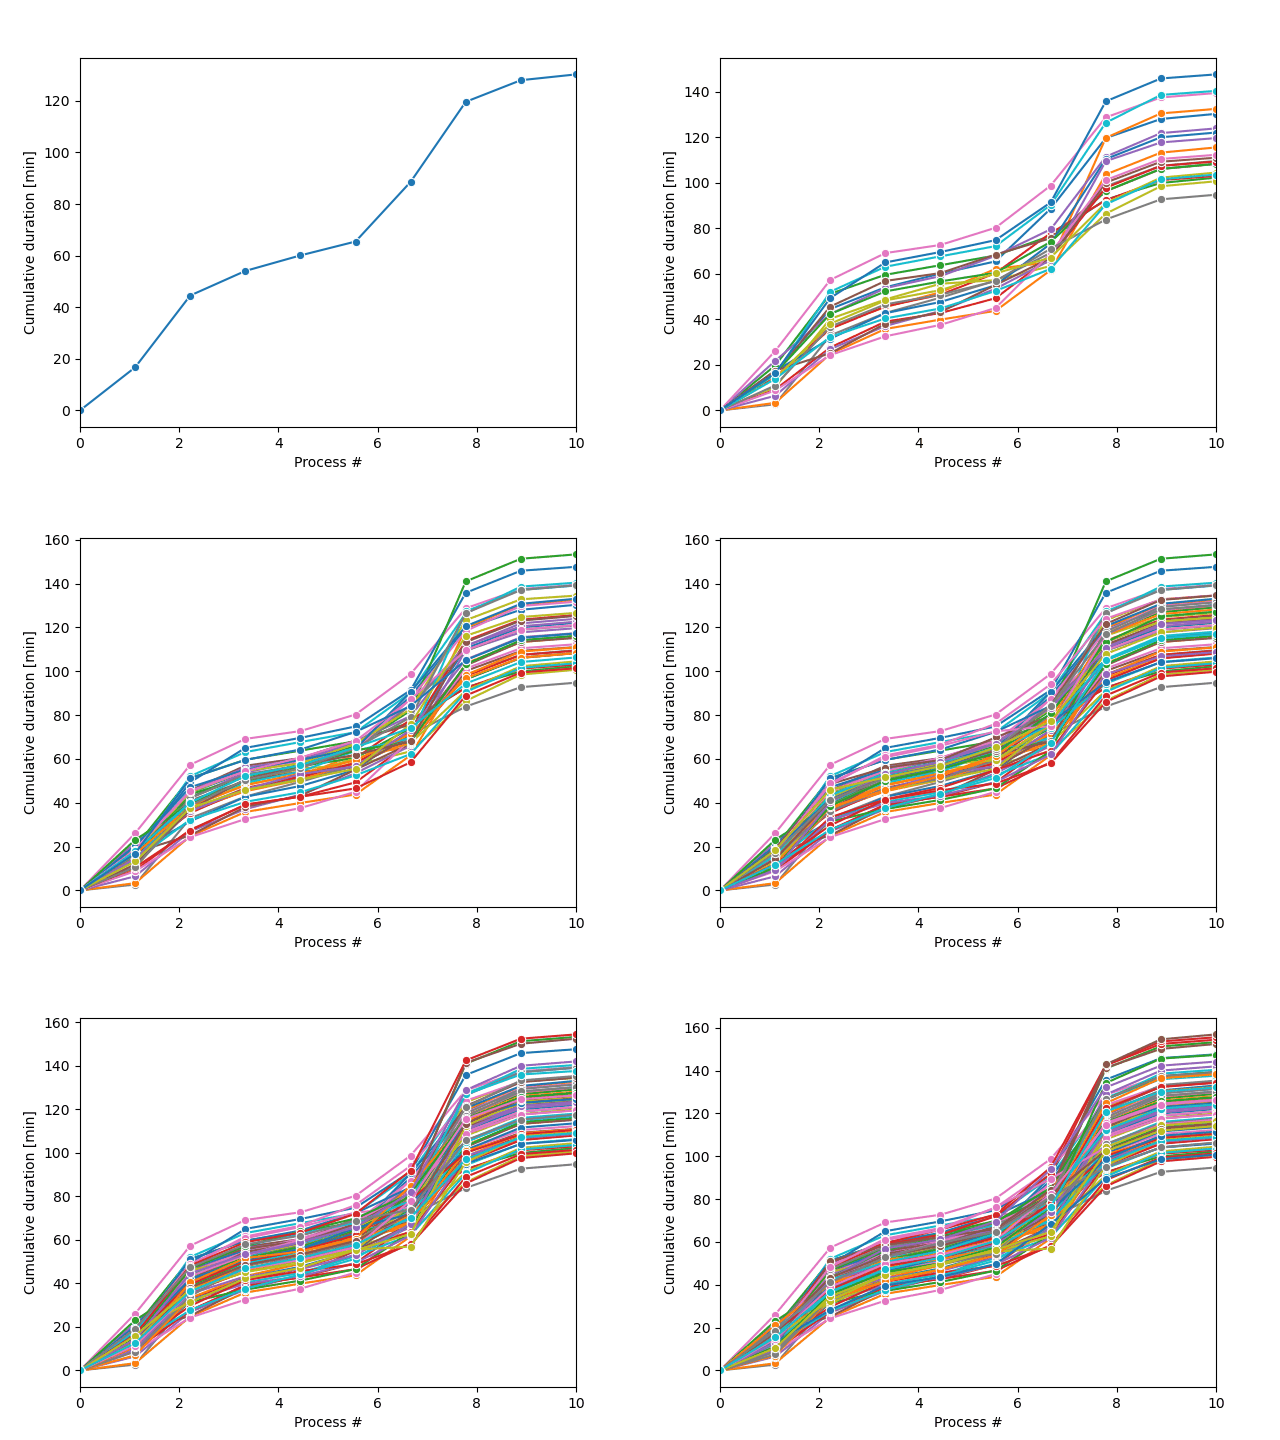
The Monte-Carlo sampling loop will produce a series of possible process trajectories, as shown in the figure.

This exercise is part of the course
Discrete Event Simulation in Python
Exercise instructions
- Clock-in and yield
process_duration. - Save the current time in
time_record. - Run a for-loop for
n_trajectoriessamples with dummy variablet. - Create the SimPy environment, add processes and run the model.
Hands-on interactive exercise
Have a go at this exercise by completing this sample code.
def manufacturing_process(env):
    global time_record
    for p in range(len(processes)):
        proc_p = processes[p]
        process_duration = random.gauss(proc_p["Average_Duration"], proc_p["Standard_Deviation"])

        # Clock-in and yield the process_duration
        yield ____

        # Save the current time in time_record
        time_record[p + 1] = ____

def run_monte_carlo(n_trajectories):

    # Run a for-loop for n_trajectories samples with dummy variable t
    ____

        # Create the SimPy environment, add processes and run the model
        env = ____
        env.____(manufacturing_process(env))
        env.____()

        plot_results()
    plt.show()

run_monte_carlo(n_trajectories = 100)