Dendrogramı yorumlama
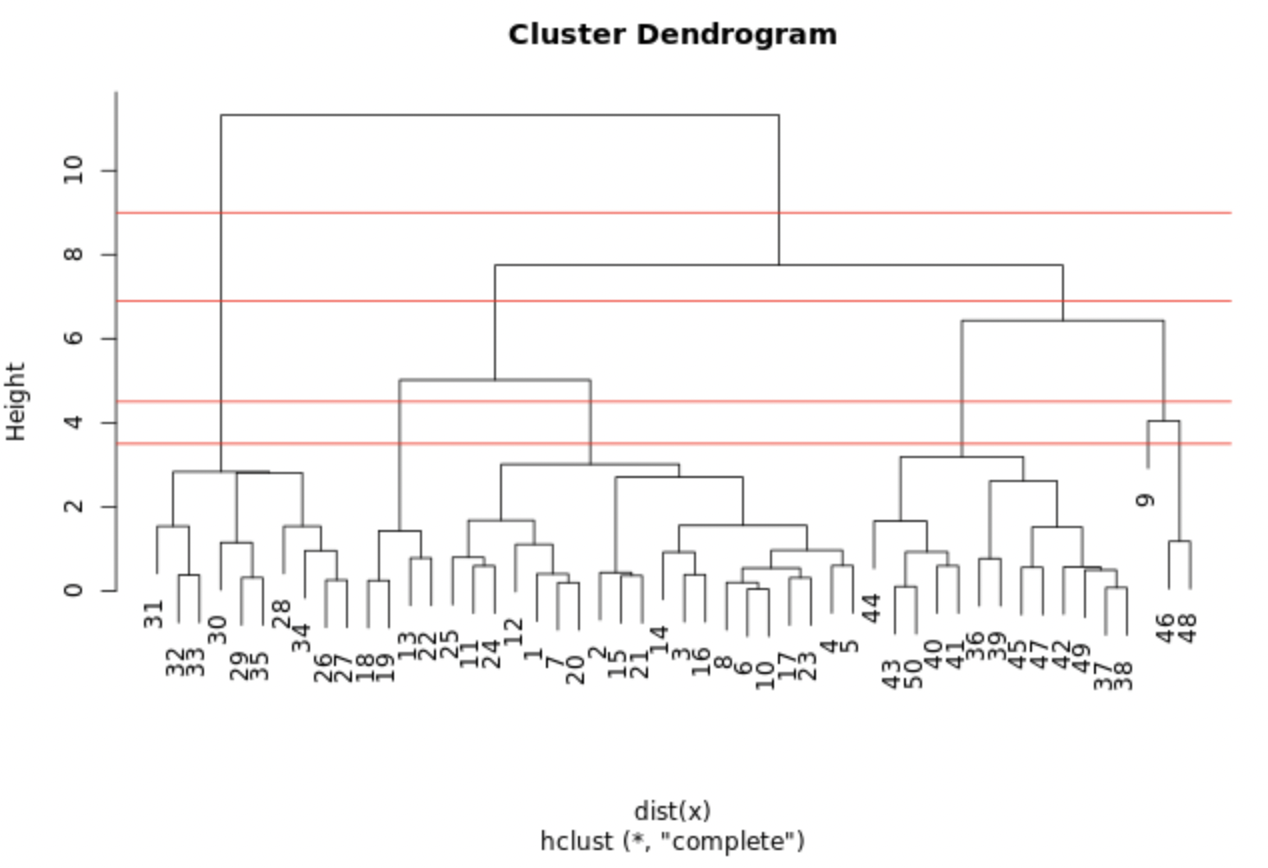
Gösterilen grafik, önceki egzersizde oluşturduğun hclust.out modelini gösteriyor. 3.5, 4.5, 6.9 ve 9.0 yüksekliklerine yatay çizgiler çizdik.
Hangi kesme noktası 3 küme verir?
Bu egzersiz, kursun bir parçasıdır
R ile Denetimsiz Öğrenme
Uygulamalı etkileşimli egzersiz
Teoriyi etkileşime dönüştürün, interaktif egzersizlerimizden biriyle
 Egzersize başla