İlgili kaymaları belirleme
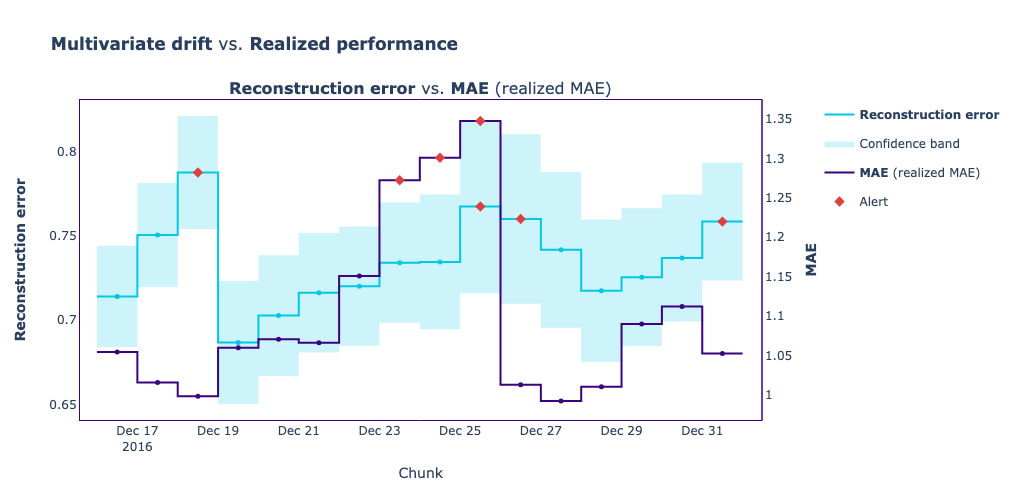
- Bölümde, modelin bahşiş tutarını tahmin ettiği Green Taxi veri kümesi örneğini hatırla. Bu egzersizde, çok değişkenli kayma tespit yönteminden elde edilen yeniden kurma hatasının günlük değerlerini açık maviyle, MAE metriği kullanılarak hesaplanan gerçekleşen performansı ise koyu maviyle gösteren bir karşılaştırma grafiği hazırladık.
Görevin, uyarı verilen bir kaymanın model performansında uyarı ile çakıştığı günü belirlemek.
Bu egzersiz, kursun bir parçasıdır
Python ile Machine Learning İzleme
Uygulamalı etkileşimli egzersiz
Teoriyi etkileşime dönüştürün, interaktif egzersizlerimizden biriyle
 Egzersize başla