Sonuçları yorumlama
Bu senaryoda, performans kestirim algoritmanı üretim ortamında başarıyla uyguladın. Sonuç olarak, tahmini ROC AUC metriği için bir grafiğin var.
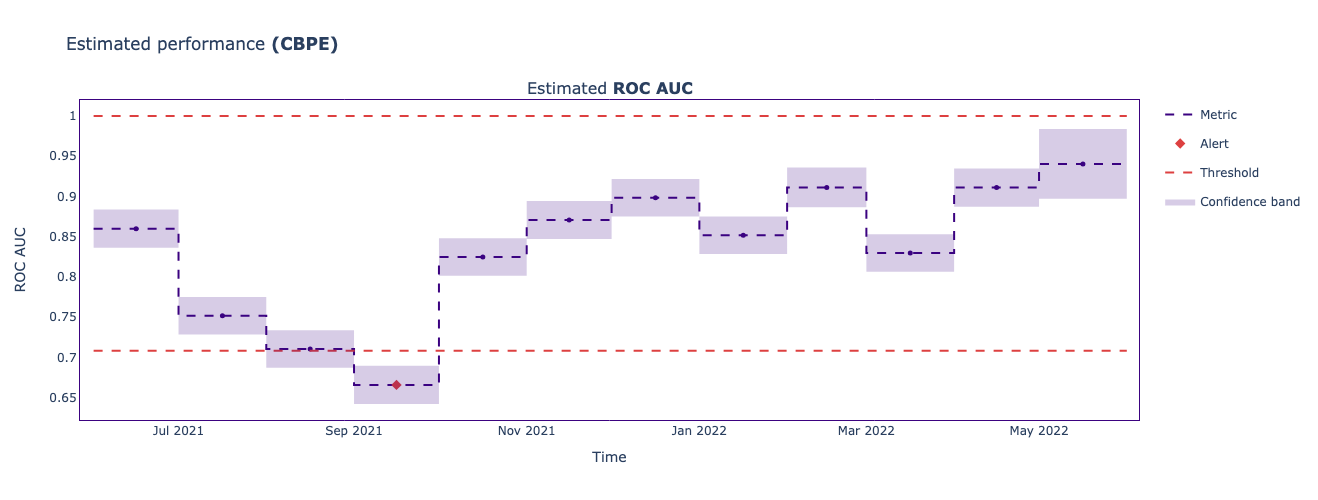
Şimdi görevin, grafiğe dayanarak aşağıdakiler hakkında doğru bilgileri seçmek:
- parça dönemi (chunk period) - izleme sonuçlarındaki tek bir veri noktası
- üst eşik
- alt eşik
- performans uyarısının tetiklendiği ayın adı
Bu egzersiz, kursun bir parçasıdır
Python ile Machine Learning İzleme
Uygulamalı etkileşimli egzersiz
Teoriyi etkileşime dönüştürün, interaktif egzersizlerimizden biriyle
 Egzersize başla