Facet grid grafiği için veriyi hazırlama
Bu egzersizde, şu grafiği oluşturmak için veriyi hazırlayacaksın:
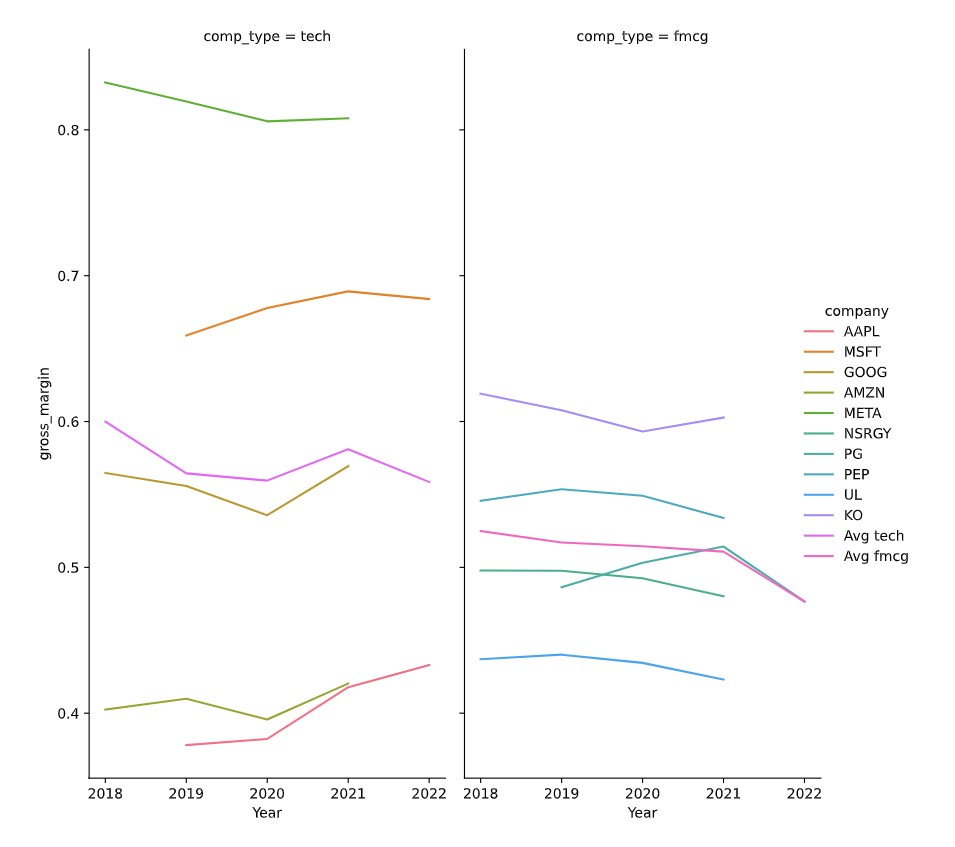 Sonraki egzersizde grafiği oluşturmayı pratik edeceksin. Bu grafikle şunları güzelce gözlemleyebilirsin:
- Teknoloji şirketlerinin brüt kâr marjı, FMCG şirketlerininkine göre daha geniş bir aralığa yayılmıştır.
- Yıllara göre bir şirketin, içinde yer aldığı sektördeki ortalama şirkete kıyasla ne kadar kârlı olduğu.
pandas kütüphanesi pd takma adıyla ve seaborn sns takma adıyla yüklendi. Senin için yüklenen pandas DataFrame’i dataset, brüt kâr marjı için önceden hesaplanmış bir gross_margin sütununa sahip.
Bu egzersiz, kursun bir parçasıdır
Python ile Finansal Tabloları Analiz Etme
Uygulamalı etkileşimli egzersiz
Bu egzersizi bu örnek kodu tamamlayarak deneyin.
# Subset tech and fmcg companies
subset_dat = dataset.loc[____]