Agrupamento k-means
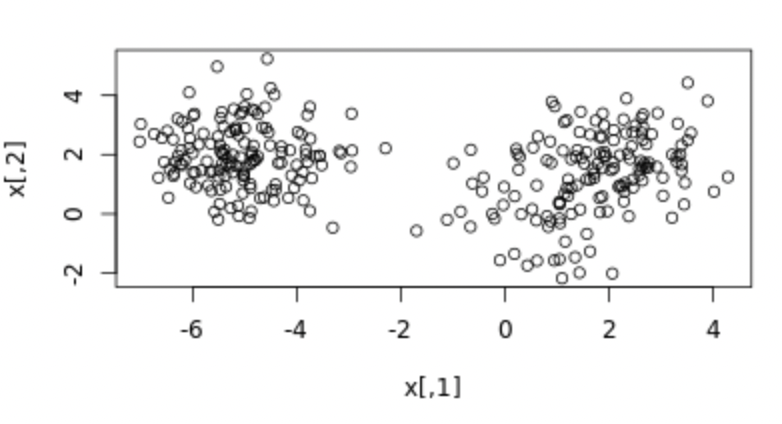
Criamos alguns dados bidimensionais e os armazenamos na variável x no seu ambiente. O gráfico de dispersão exibido é uma representação visual dos dados.
Neste exercício, sua tarefa é criar um modelo de k-means para os dados x usando 3 clusters e, em seguida, examinar a estrutura do modelo resultante usando a função summary().
Este exercício faz parte do curso
Aprendizado não supervisionado em R
Instruções do exercício
- Ajuste um modelo de k-means para
xusando 3 centros e execute o algoritmo de k-means 20 vezes. Armazene o resultado emkm.out. - Inspecione o resultado com a função
summary().
Exercício interativo prático
Experimente este exercício completando este código de exemplo.
# Create the k-means model: km.out


# Inspect the result