Interpretando o dendrograma
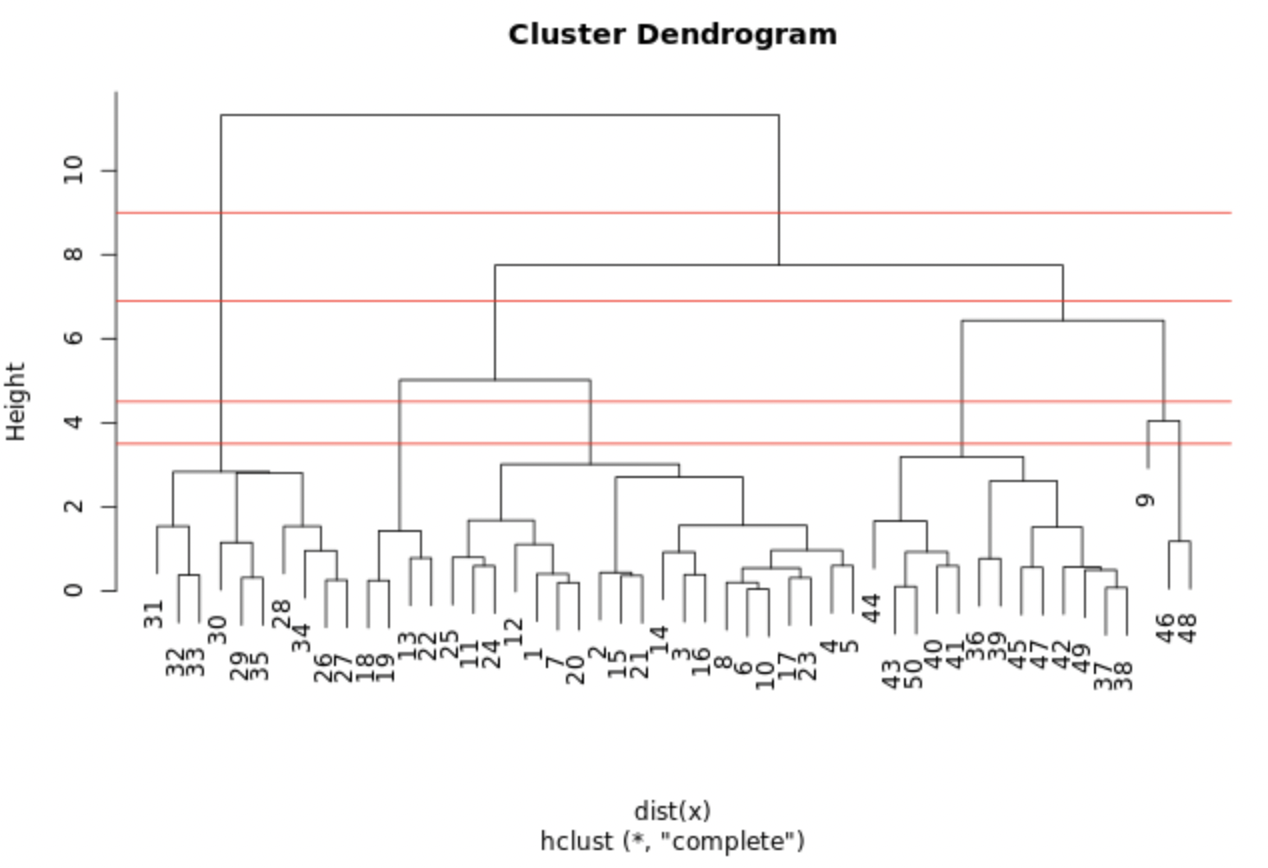
O gráfico exibido mostra o modelo hclust.out que você construiu no exercício anterior. Desenhamos linhas horizontais nas alturas 3.5, 4.5, 6.9 e 9.0, respectivamente.
Qual ponto de corte resulta em 3 clusters?
Este exercicio faz parte do curso
Aprendizado não supervisionado em R
exercicio interativo prático
Transforme teoria em prática com um dos nossos exercicio interativos
 Iniciar exercicio