Preparando dados para um gráfico com facet grid
Neste exercício, você vai preparar os dados para criar este gráfico:
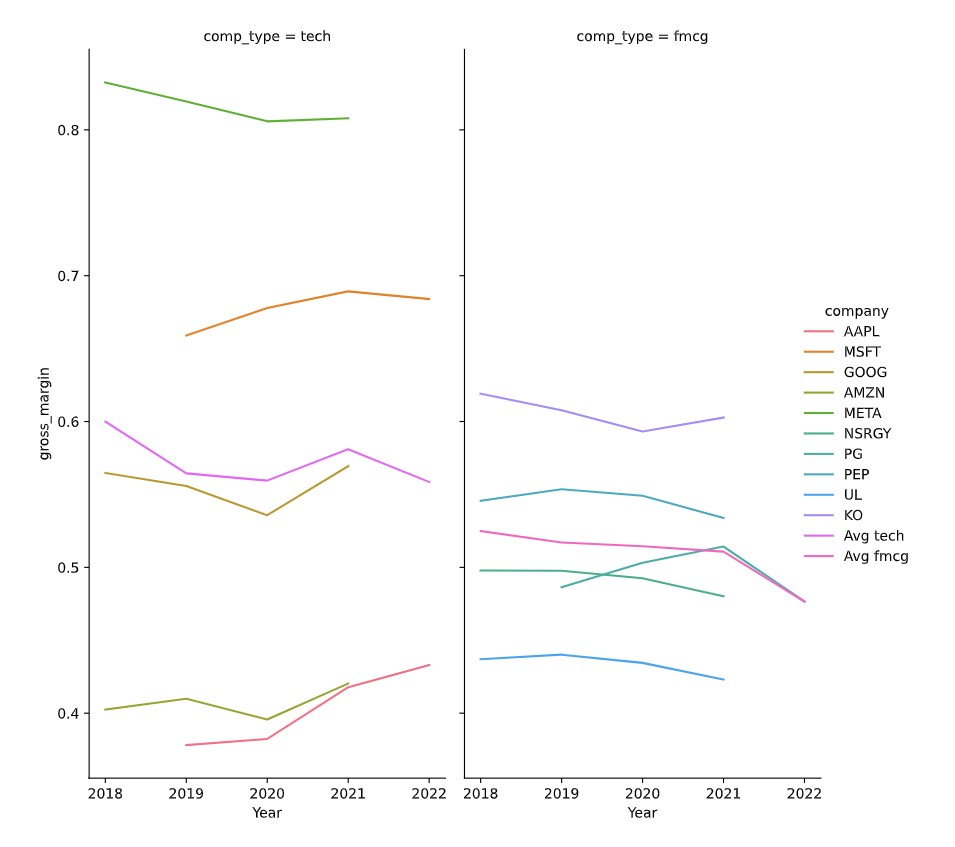 No próximo exercício, você vai praticar como montar o gráfico. Este é um gráfico interessante para observar:
- A margem bruta das empresas de tecnologia é mais espalhada do que a das empresas de bens de consumo de giro rápido (FMCG)
- Ano a ano, quão lucrativa uma empresa é em comparação com a média do seu setor.
pandas está carregado com o alias pd e seaborn está carregado com o alias sns. Um DataFrame do pandas chamado dataset já foi carregado para você e já possui a coluna gross_margin calculada.
Este exercicio faz parte do curso
Análise de Demonstrativos Financeiros em Python
exercicio interativo prático
Tente este exercicio completando este código de exemplo.
# Subset tech and fmcg companies
subset_dat = dataset.loc[____]